Who has the fastest website in F1?
I was trying to make my predictions for the new Formula One season by studying the aerodynamics of the cars, their cornering speeds, their ability to run with different amounts of fuel. Then it hit me: I have no idea what I'm doing.
So, I'm going to make my predictions the only way I know how: By comparing the performance of their websites. That'll work right?
If anything, it'll be interesting to compare 10 sites that have been recently updated, perhaps even rebuilt, and see what the common issues are. I'll also cover the tools and techniques I use to test web performance.
Methodology
I'm going to put each site through WebPageTest to gather the data on Chrome Canary on a Moto G4 with a 3g connection.
Although a lot of us have 4g-enabled data plans, we frequently drop to a slower connection. A consistent 3g connection will also suggest what the experience would be like in poor connectivity.
Trying to use a site while on poor connectivity is massively frustrating, so anything sites can do to make it less of a problem is a huge win.
In terms of the device, if you look outside the tech bubble, a lot of users can't or don't want to pay for a high-end phone. To get a feel for how a site performs for real users, you have to look at mid-to-lower-end Android devices, which is why I picked the Moto G4.
I'm using Chrome Canary because WPT seems to be glitchy with regular Chrome right now. Yeah, not a great reason, but the test wasn't useful otherwise.
Oh, and whenever I talk about resource sizes, I'm talking about downloaded bytes, which means gzip/brotli/whatever.
Calculating race time
The amount of bandwidth your site uses matters, especially for users paying for data by the megabyte. However I'm not going to directly score sites based on this. Instead, I'm going to rate them on how long it takes for them to become interactive. By "interactive", I mean meaningful content is displayed in a stable way, and the main thread is free enough to react to a tap/click.
Caching is important, so I'm going to add the first load score to the second load score.
There's some subjectivity there, so I'll try and justify things as I go along.
Issues with the test
I'm not comparing how 'good' the website is in terms of design, features etc etc. In fact, about:blank would win this contest. I love about:blank. It taught me everything I know.
I'm only testing Chrome. Sorry. There's only one of me and I get tired. In fact, with 10 sites to get through, it's possible I'll miss something obvious, but I'll post the raw data so feel free to take a look.
I only used "methodology" as a heading to try and sound smart. But really, this is fun, not science.
Also, and perhaps most importantly, the results aren't a reflection of the abilities of the developers. We don't know how many were on each project, we don't know what their deadline was or any other constraints. My goal here is to show how I audit sites, and show the kind of gains that are available.
Bonus round: images
For each site I'll take a look at their images, and see if any savings can be made there. My aim is to make the image good-enough on mobile, so I'll resize to a maximum of 1000px wide, for display at no larger than 500px on the device's viewport (so it looks good on high density mobile devices).
Mostly, this is an excuse to aggressively push Squoosh.
Ok. It's lights out, and away we go…
Mercedes
Mercedes make cars. You might have seen one on a road. They're a big company, so their F1 team is a sub brand. They're also one of the few teams with the same drivers as 2018, so this might not be a 'new' site. Let's take a look:
First lap
Ok, this is going to be a longer section than usual as I go through the tools and techniques in more detail. Stick with me. The following sections will be shorter because, well, the technique is mostly the same.
I like WebPageTest as it runs on a real devices, and provides screenshots and a waterfall. From the results above, the median first run is 'Run 3', so let's take a look at the 'Filmstrip view':

In terms of user experience, we've got 6.8s of nothing, then a spinner until 13.7s. Showing a spinner is definitely better than showing nothing, but only just. A full-page spinner is basically an admission of being too slow and apologising to the user. But can it be avoided in this case?
WebPageTest's waterfall diagram allows us to match this up with network and main thread activity:
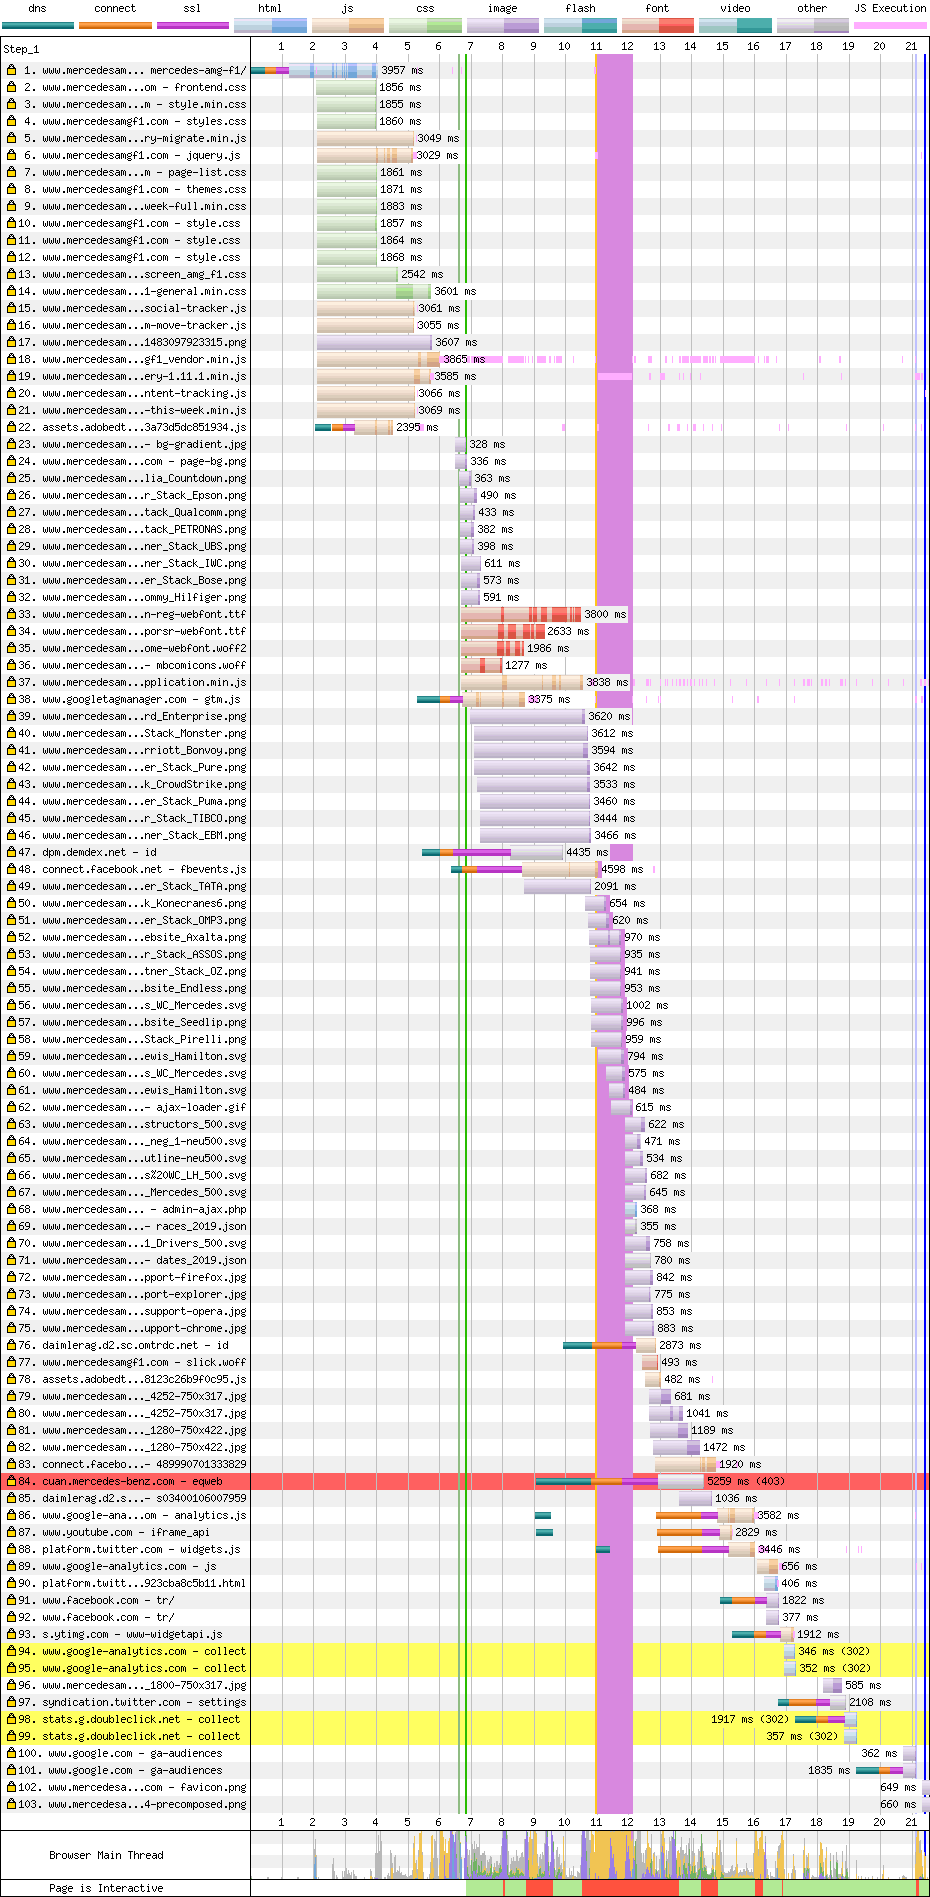
You don't need to use WebPageTest to get this kind of overview. Chrome DevTools' "Performance" panel can give you the same data.
Notice how the waterfall has 'steps'. As in, entry 23 is on another step from the things before, and step 50 is on yet another step.
This suggests that something before those things prevented them from downloading earlier. Usually this means the browser didn't know in advance that it needed that resource.
The green vertical line shows 'first render', but we know from the filmstrip that it's just a spinner. Let's dig in.
The green line appears after the first 'step' of items in the waterfall. That suggests one or more of those resources was blocking the render. Viewing the source of the page shows many <script src> tags in the head.
<head>
  …
  <script
    type="text/javascript"
    src="https://www.mercedesamgf1.com/en/wp-includes/js/jquery/jquery.js?ver=1.12.4"
  ></script>
  <script
    type="text/javascript"
    src="https://www.mercedesamgf1.com/en/wp-includes/js/jquery/jquery-migrate.min.js?ver=1.4.1"
  ></script>
  <script
    type="text/javascript"
    src="https://www.mercedesamgf1.com/wp-content/plugins/duracelltomi-google-tag-manager/js/gtm4wp-form-move-tracker.js?ver=1.8.1"
  ></script>
  <script
    type="text/javascript"
    src="https://www.mercedesamgf1.com/wp-content/plugins/duracelltomi-google-tag-manager/js/gtm4wp-social-tracker.js?ver=1.8.1"
  ></script>
  <script
    type="text/javascript"
    src="https://www.mercedesamgf1.com/wp-content/plugins/duracelltomi-google-tag-manager/js/analytics-talk-content-tracking.js?ver=1.8.1"
  ></script>
  <script
    type="text/javascript"
    src="https://www.mercedesamgf1.com/wp-content/plugins/events-calendar-pro/src/resources/js/widget-this-week.min.js?ver=4.0.6"
  ></script>
  …
</head>
These block rendering by default. Adding the defer attribute prevents them blocking rendering, but still lets them download early. Ire Aderinokun wrote an excellent article on this if you want to know more.
Adding defer to those scripts will allow the page to render before those scripts have executed, but there might be some additional work to ensure it doesn't result in a broken render. Sites that have been render-blocked by JS often come to rely on it.
Ideally pages should render top-to-bottom. Components can be enhanced later, but it shouldn't change the dimensions of the component. I love this enactment of reading the Hull Daily Mail website, especially how they capture the frustration of layout changes as well as popups. Don't be like that.
For instance, interactive elements like the carousel could display the first item without JS, and JS could add the rest in, plus the interactivity.

This is what I'd like to see. The before-JS render is missing the elements that require JS for interactivity. Once the JavaScript loads, it adds them in.
Looking at the page source, the HTML contains a lot of content, so they're already doing some kind of server render, but the scripts prevent them from taking advantage of it.
Over on WebPageTest you can click on items in the waterfall for more info. Although at this point I find Chrome Devtools' "Network" panel easier to use, especially for looking at the content of the resources.
The render-blocking scripts weigh in around 150k, which includes two versions of jQuery. There's over 100k of CSS too. CSS also blocks rendering by default, but you want it to block for initial styles, else the user will see a flicker of the unstyled page before the CSS loads.
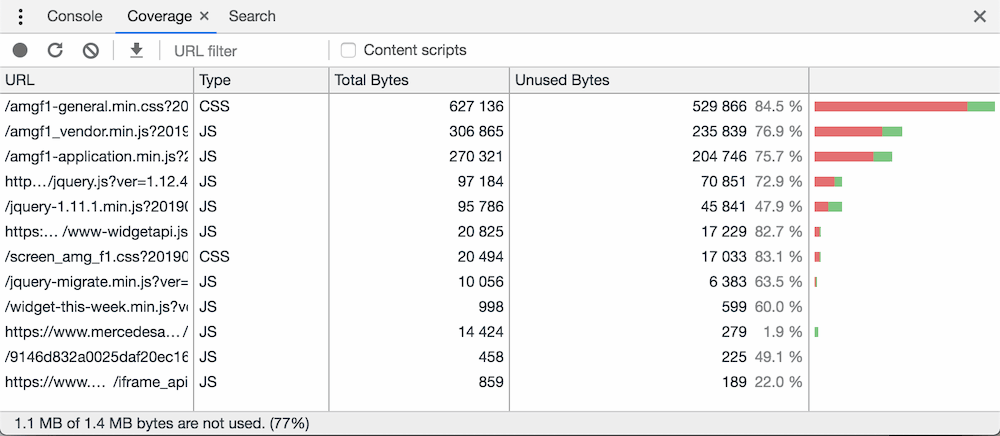
Chrome Devtools' code coverage tool says over 80% of the CSS is unused for first render, along with 75% of the JS. These should be split up so the page is only loading what it needs. For JavaScript, modern build tools like webpack, rollup.js, and Parcel support code-splitting for JavaScript.
Splitting CSS isn't as easy. Keeping CSS tightly coupled with their components makes it easier to identify CSS that isn't needed for a particular page. I really like CSS modules as a way to enforce this.
There are tools that automate extracting 'above the fold' CSS. I've had mixed results with these, but they might work for you.
The second 'step' of the waterfall contains some render-altering fonts. The browser doesn't know it needs fonts until it finds some text that needs them. That means the CSS downloads, the page is laid out, then the browser realises it needs some fonts. <link rel="preload" as="font" href="…"> in the <head> would be a quick-win here. This means the browser will download the fonts within the first step of the waterfall. For more info on preloading, check out Yoav Weiss' article.
Also, the fonts weigh in around 350k, which is pretty heavy. 280k of this is in TTF. TTF is uncompressed, so it should at least be gzipped, or even better use woff2, which would knock around 180k off the size. font-display: optional could be considered here, but given it's part of corporate identity, sighhhhhhhh it might not get past the brand folks.
There's another render-blocking script in this part of the waterfall. The download starts late because it's at the bottom of the HTML, so it should be moved to the <head> and given the defer attribute.
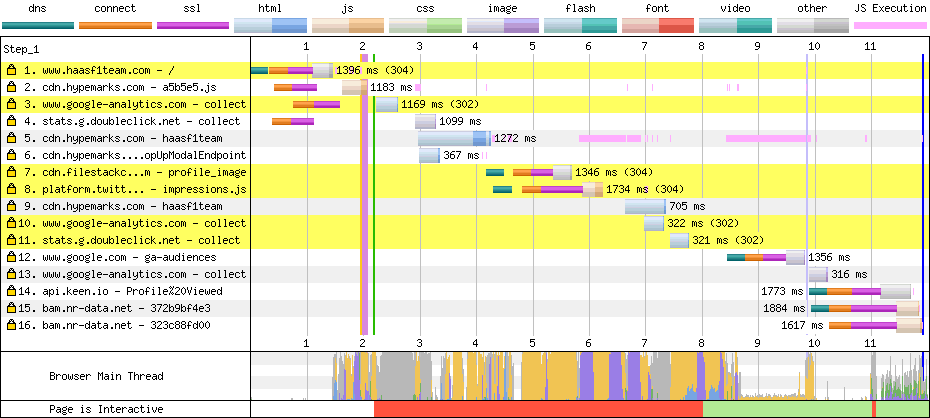
Then, the Moto 4 gets locked up for 3 seconds. You can see this from the red bar at the bottom of the waterfall. WebPageTest shows little pink lines next to script when they're using main-thread time. If you scroll up to row 19, you can see it's responsible for a lot of this jank.
Second lap
Let's take a look at the second load:

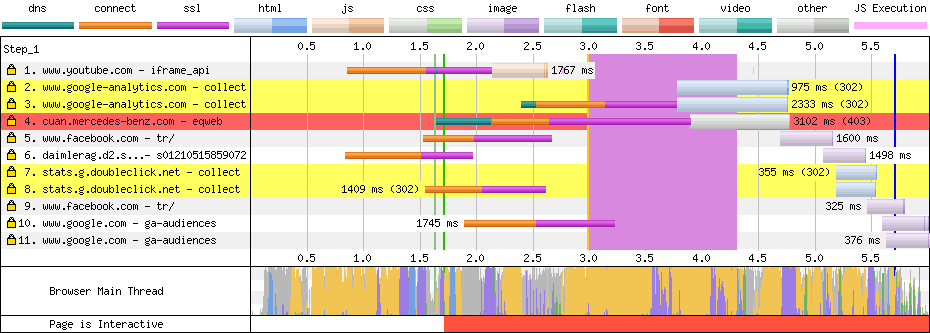
Aside from the HTML, none of the resources have Cache-Control headers. But browser heuristics step in, and as a result the cache is used for most assets anyway. This is kinda cheating, and unlikely to reflect reality, but hey, I can't change the rules now. For a refresher on caching, check out my article on best practices.
The lack of caching headers seems like an oversight, because a lot of the assets seem to have version numbers. Most of the work has been done, it just lacks a little server configuration.
Unfortunately, despite the heuristic caching, it still takes 5.8s to get into a useable state, and this is all down to JavaScript execution. The fixes I mentioned above would cover this too. Apply code splitting, and allow rendering before JS.
Images
They've done a pretty good job of image compression here. They appear to be using some JavaScript to load smaller versions of images for mobile devices. You don't need JavaScript for this. Using JS for this delays image loading.
Using Squoosh I could get the first image down from 50k to 29k without significant loss. See the results and judge for yourself.
Result
- Mercedes 19.5s
So, Mercedes storm into 1st place and last place at the same time, as often happens with the first result.
- good HTTPS
- good HTTP/2
- good Gzip, except TTF
- good Minification
- good Image compression
- bad Render-blocking scripts
- bad Late-loading fonts
- bad No cache control
- bad Unnecessary CSS
- bad Unnecessary JS
- bad Badly compressed fonts
My gut feeling is the quick-wins (preloading, compressing fonts) would half this time. I imagine the refactoring of the JS and CSS would be a much bigger task, but would bring big results.
Ferrari
Ferrari also make cars. You might have seen one on a road, driven by a wanker (except my friend Matt who bucks this trend. Hi Matt!).
They have a new driver this year, and a slightly different livery, so this site may have been changed fairly recently.
First lap

In terms of user experience there's 33s of nothing, some content at 34.3s, but things move around until 36s. This is around twice as long as Mercedes, so things aren't looking good.
Let's dive in:
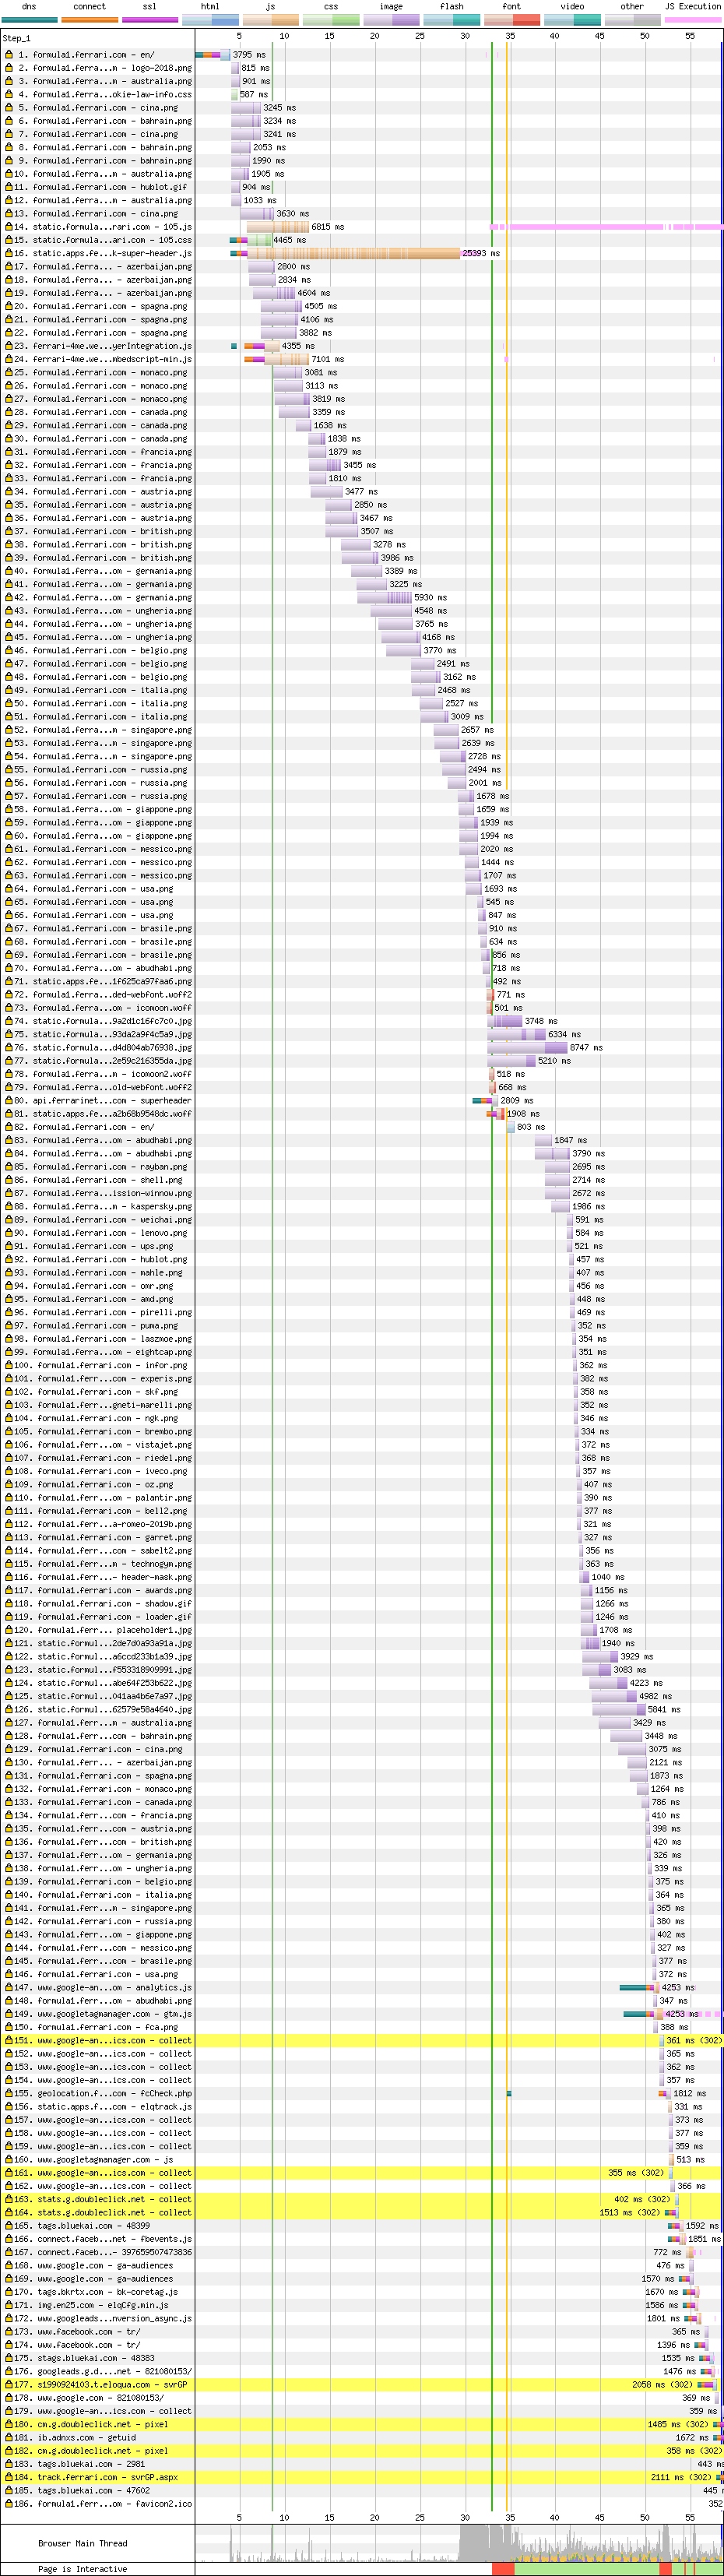
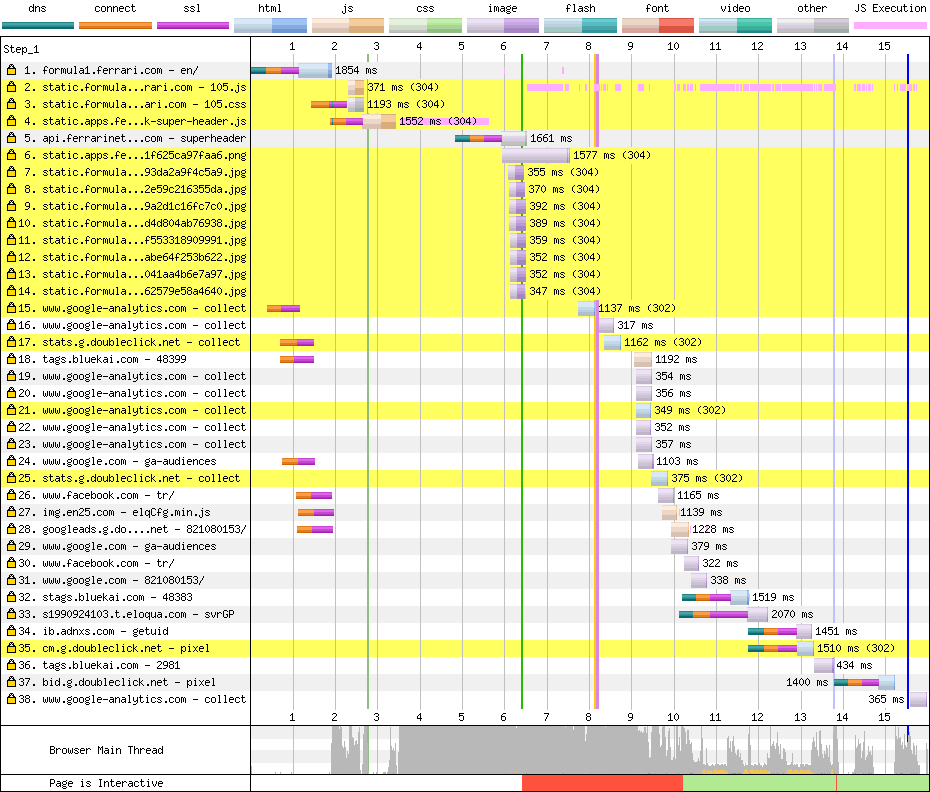
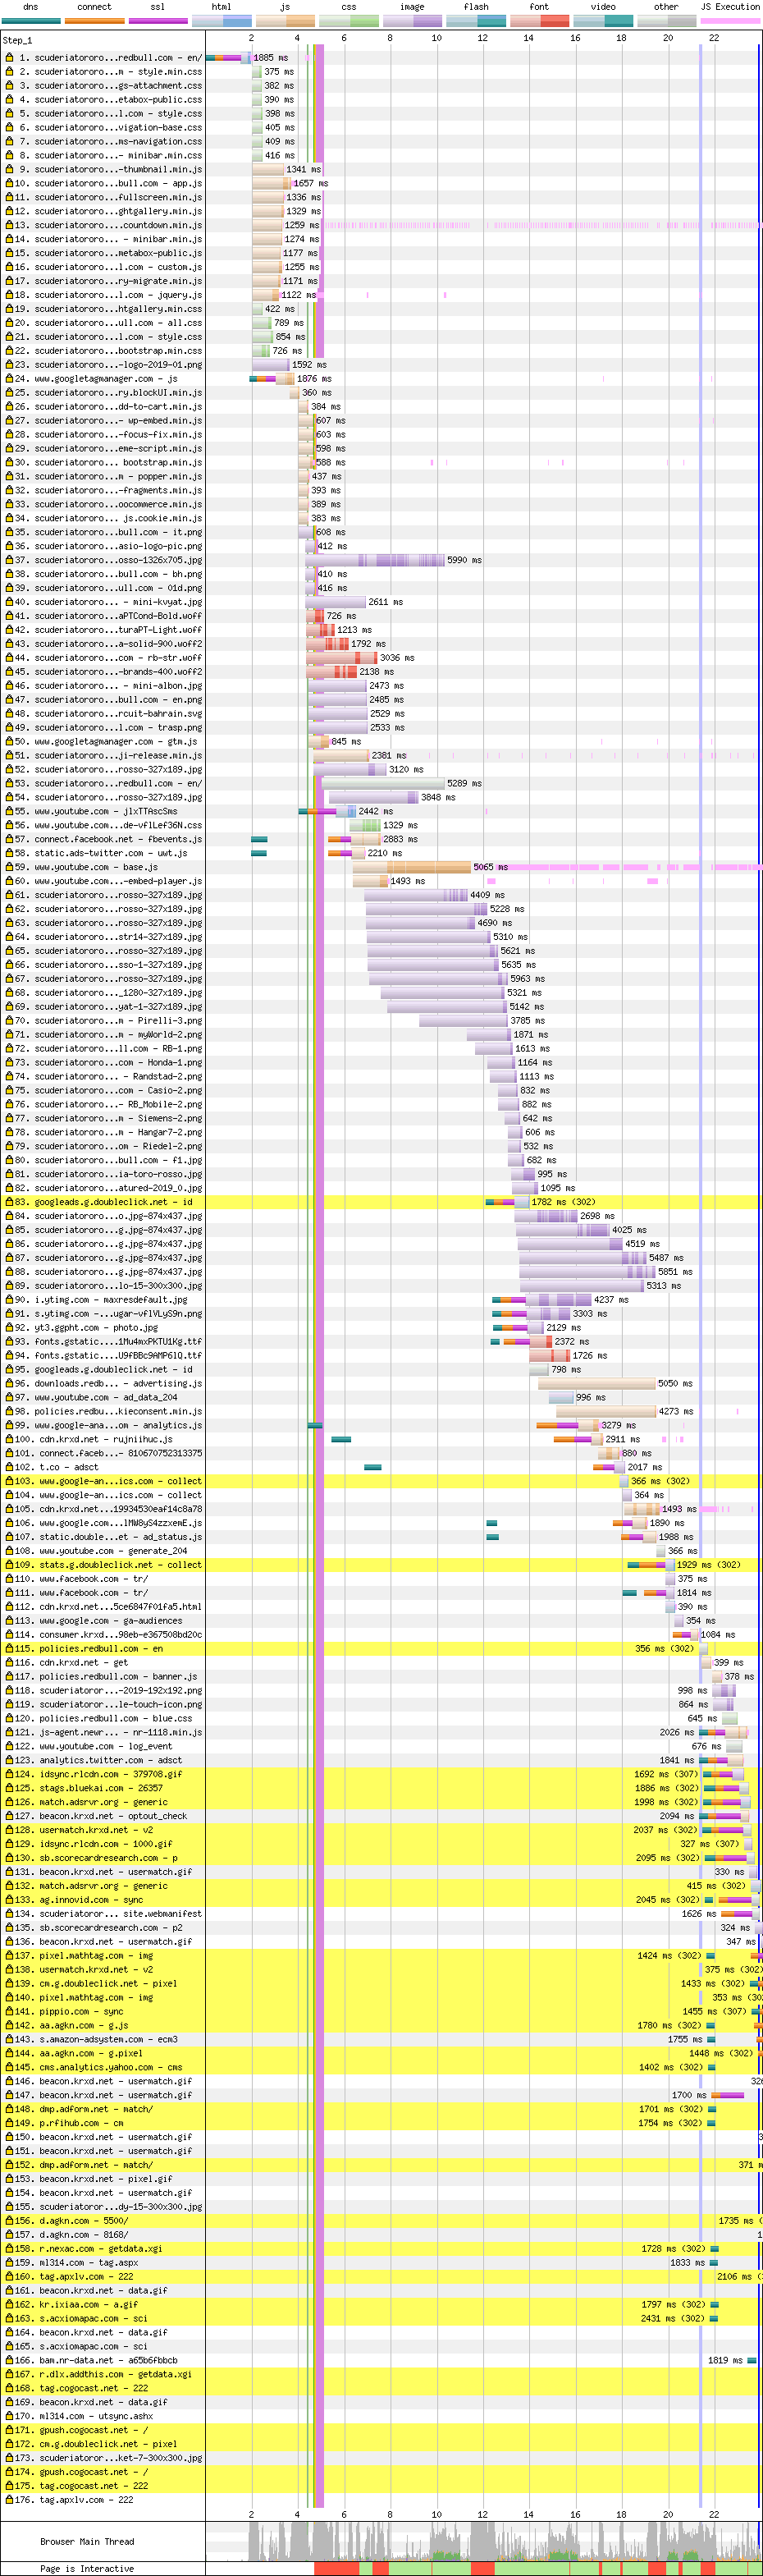
Wow that's a lot of requests! But, Ferrari use HTTP/2, so it isn't such a big deal. I should mention, this article is a real workout for your scrolling finger.
The stand-out issue is that huge row 16. It's a render-blocking script.
It's also on another server, so it needs to set up a new HTTP connection, which takes time. You can see this in the waterfall by the thinner green/orange/purple line which signifies the various stages of setting up a connection.
However, the biggest issue with that script, is it's 1.8mb. There's also an additional 150k script that isn't minified, and other scripts which sit on different servers.
The CSS is 66k and 90% unused, so this could benefit from splitting. There are a few fonts that would benefit from <link rel="preload"> but they're pretty small. Let's face it, everything is small compared to the JS. Oddly, Chrome's coverage tool claims 90% of the JS is used on page load, which beggars belief.
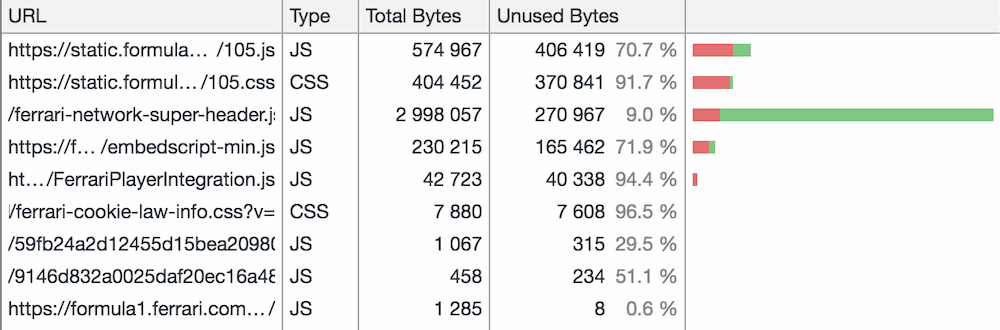
I dug into their JavaScript and saw a lot of locale data in there, which should be split out, but then I saw a large chunk of base64. You'll never guess what it is. It's this:

No, not the whole thing. The logo. No, not the whole logo, that's SVG. But the horse, the horse is a base64 PNG within the SVG:

Look at it. It's beautiful. It's 2300x2300. It's 1.7mb. 90% of their performance problem is a massive bloody horse. That logo appears across the main Ferrari site too, so it's probably something the creator of the F1 site had little control over. I wonder if they knew.
Again, there seems to be server rendering going on, but it's rendered useless by the script.
There also seems to be multiple versions of the same image downloading.
Second lap

The site has ok caching headers, so I'm surprised to see the browser revalidating some of those requests.
The big problem here is still the JS, which takes up two seconds of main thread time. The main-thread then gets locked up until 10.1s. This isn't by JavaScript. I'm not 100% sure what it is, but I suspect it's image-decoding that horse.
Images
First things first, let's tackle that logo. SVG might be the best format for this, but with the bitmap-horse replaced with a much simpler vector-horse (Vector Horse's debut album is OUT NOW). However, I don't have a vector version of the horse, so I'll stick with a bitmap.
The logo is only ever displayed really-tiny in the top-left, at a height of 20px. Using Squoosh, I'm going to make a 60px version so it stays sharp on high-density devices. That takes the image from 1.7mb, to a 2.6k PNG, or a 1.7k WebP. See the results.
One of the initial images on the site is of the 2019 Ferrari. However, it's 1620px wide, and not really optimised for mobile. I took the image down from 134k to 23k as JPEG, or 16k as WebP without significant loss. But, you can be the judge. WebP shines here because JPEG struggles with smooth gradients – at lower sizes it creates banding which is really noticeable.
The page also contains little track maps that aren't initially displayed. These should be lazy-loaded, but they could also do with a bit of compression. I was able to get one of them down from 145k to 27k as a PNG without noticeable loss. Again, you be the judge.
Result
- Mercedes 19.5s
- Ferrari 46.1s
Last place for now.
Most of their problem is down to one horse. I don't think anyone did that deliberately, but RUM & build time metrics would have made it obvious.
- good HTTPS
- good HTTP/2
- good Gzip
- good Caching
- bad Render-blocking scripts
- bad Unnecessary JS
- bad Unnecessary CSS
- bad Unminified scripts
- bad Unstable render
- bad Poor image compression
- bad Late-loading fonts
- bad Main thread lock-up
- bad Horse
Red Bull
Red Bull aren't a car company. They sell drinks of a flavour I can only describe as "stinky medicine". But, they're also a much more modern, tech-savvy company, so it'll be interesting to see if it shows here.
First lap

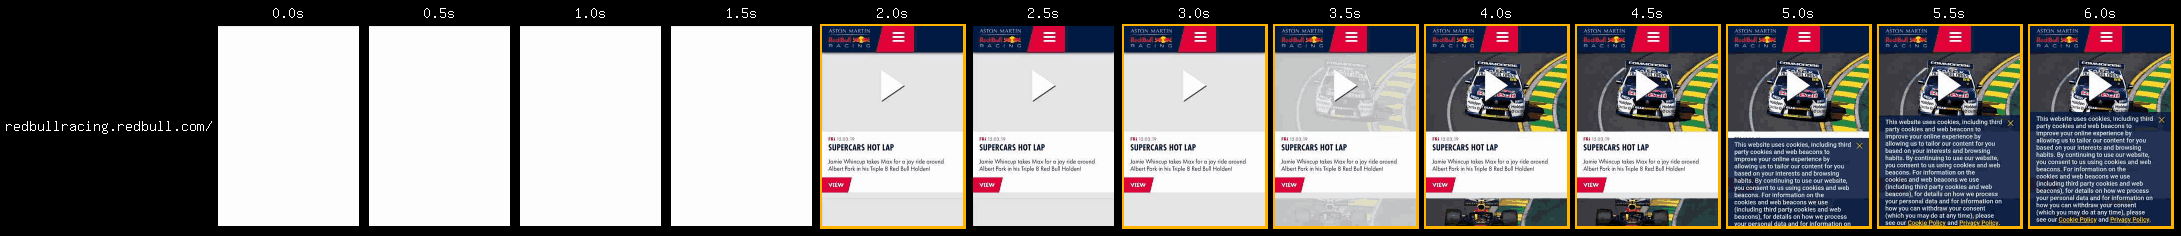
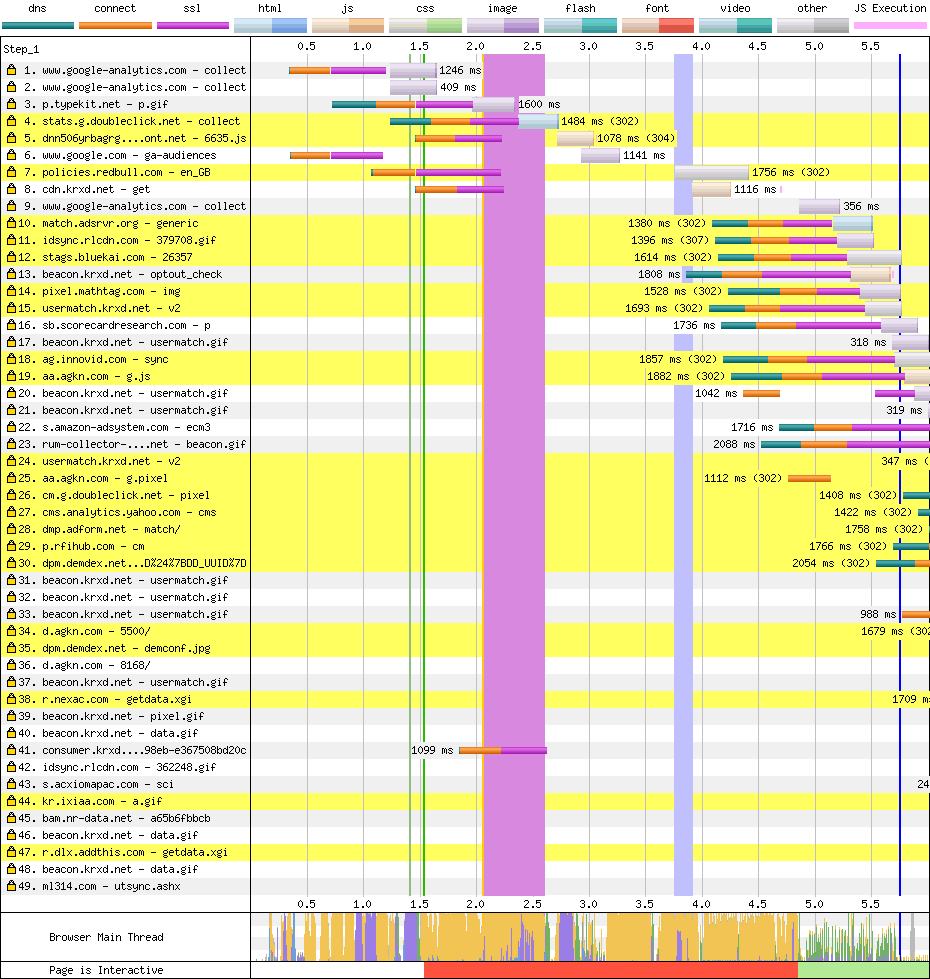
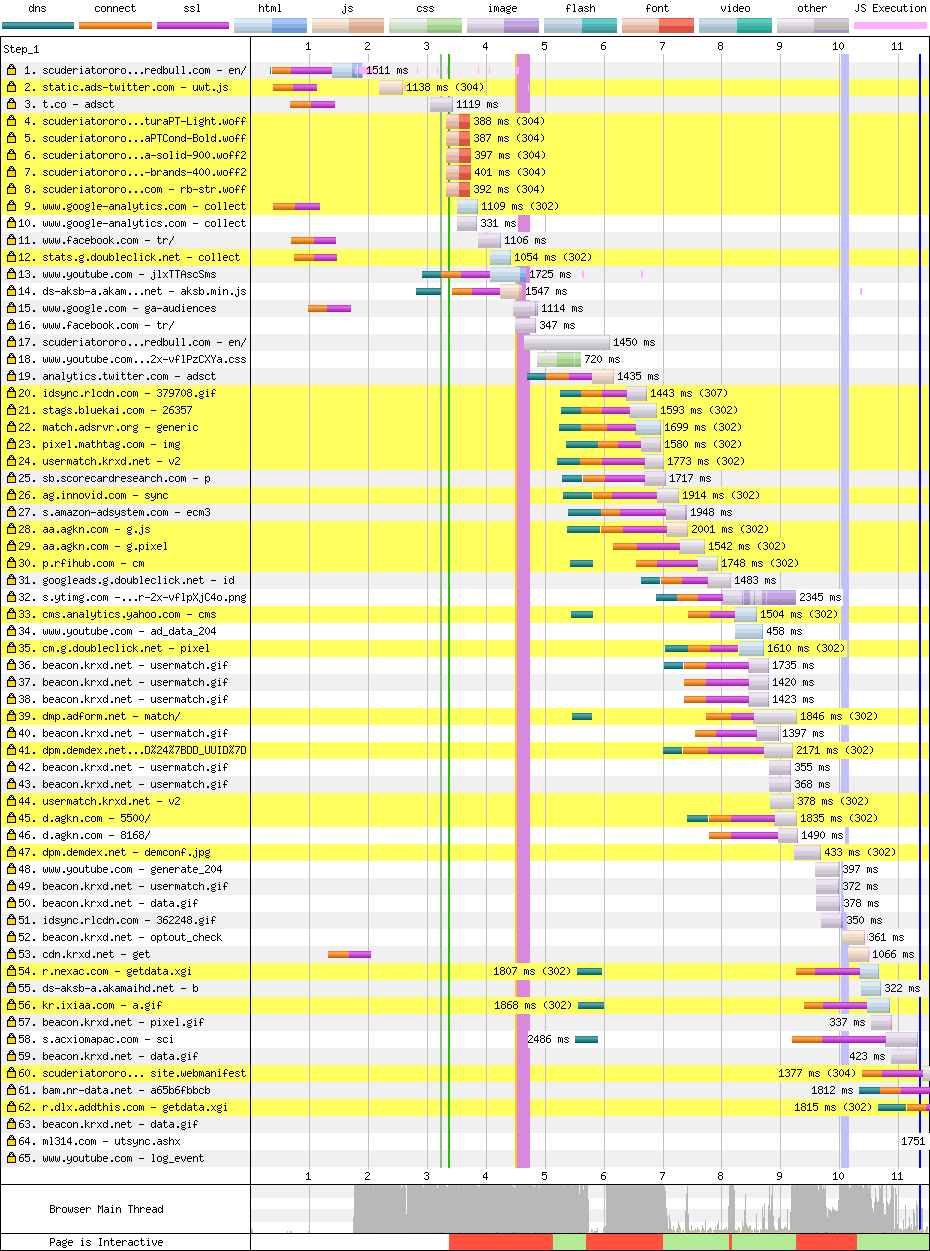
The user experience is 4.9s of nothing, but the result is a broken UI. Things sort themselves out at around 6.5s. There's a font switch at 9.5s, and a horrendous cookie warning at 16s. But, I'd call this visually ready at 6.5s.
Unfortunately we can't call this page ready at 6.5s, as the main thread is locked up until 11s. Still, this takes it into 1st place by a couple of seconds.
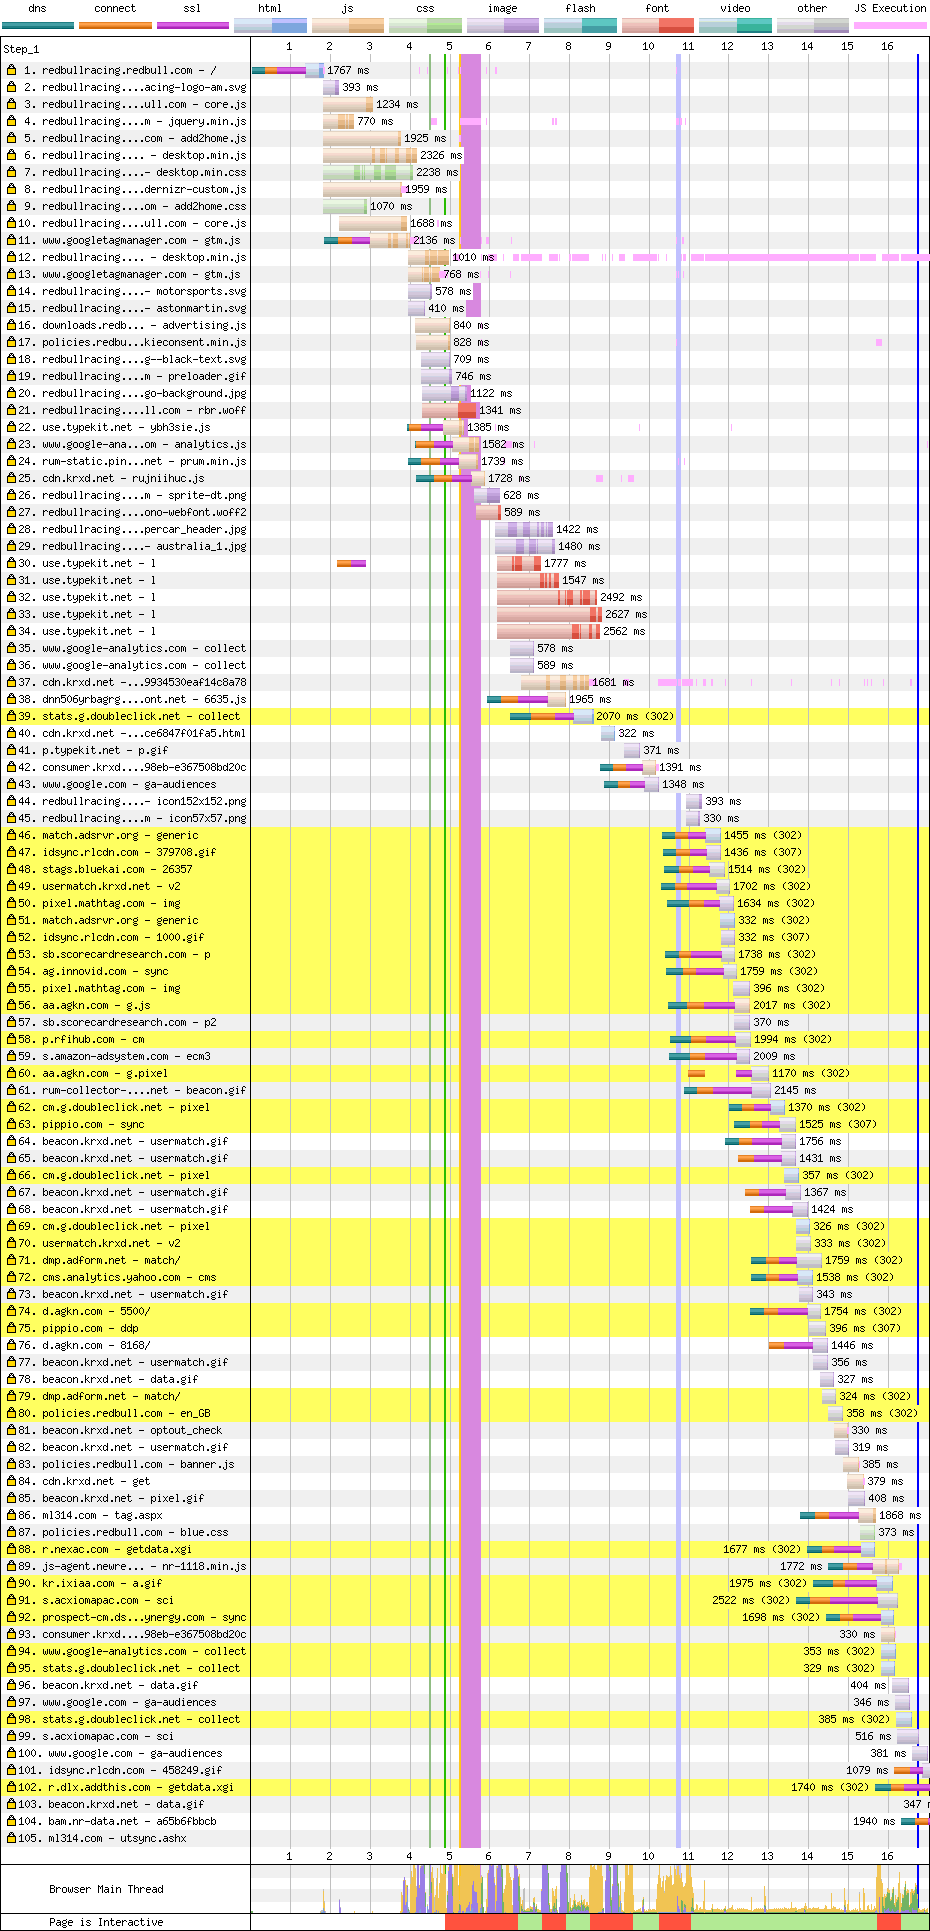
The story here is very similar to the previous sites. The page contains what looks like a server render, including minified HTML, but render-blocking scripts prevent it being shown. The scripts should use defer.
The CSS is 90% unused, and the JS is ~75% unused, so code-splitting and including only what's needed for this page would have a huge benefit. This might help with the main thread lock-ups too.
Again, the fonts start loading way too late. <link rel="preload"> would be a quick win here.
The icon font times-out, which causes a broken render. There isn't really a good reason to use icon fonts these days. Icon fonts should be replaced with SVG.
The site does use <link rel="preload">, but it's mostly used for JS and CSS, which don't really need preloading as they're already in the <head>. Worse, they preload a different version of the scripts to the ones they use on the page, so they're doubling the download. Chrome's console shows a warning about this.

Second lap
Thanks to decent caching, we get a render really quickly. However, JS bogs down the main thread for many seconds afterwards, so the page isn't really interactive until the 4.8s mark.
Ideally the JavaScript would be chunked up so it only hits the main thead during idle time, or just as the user needs it.
Images
Like Mercedes, Red Bull uses responsive images, but use JavaScript to make it work. Still, this is better than serving full size images to mobile.
The images could be smaller though. Taking the first image on their page, Using Squoosh I can take it down from 91k to 36k as a JPEG, or 22k as WebP. See the results.
They also use a spritesheet, which might not be necessary thanks to HTTP/2. By bringing the palette down to 256 colours, I can take it down from 54k to 23k as PNG, or 18k as WebP. See the results.
Result
- Mercedes 19.5s
- Ferrari 46.1s
- Red Bull 15.8s
Despite issues, Red Bull are straight into 1st place by almost 4 seconds. Nice work!
- good HTTPS
- good HTTP/2
- good Gzip
- good Minification, including HTML
- good Image compression
- good Caching
- bad Render-blocking scripts
- bad Main thread lock-up
- bad Unnecessary CSS
- bad Unnecessary JS
- bad Late-loading fonts
- bad Unnecessary icon fonts
Renault
Back to folks that make cars. Car adverts tend to be awful, but I reckon Renault make the worst ones. Also, they may have spent too much money on one of their drivers and not have enough left over for their website. Let's see…
First lap

The user gets 5.8s of nothing, then a broken render until 7.8s, but the intended content of the page doesn't arrive until 26.5s. Also, asking for notification permission on load should be a black flag situation, but I'll be kind and ignore it.
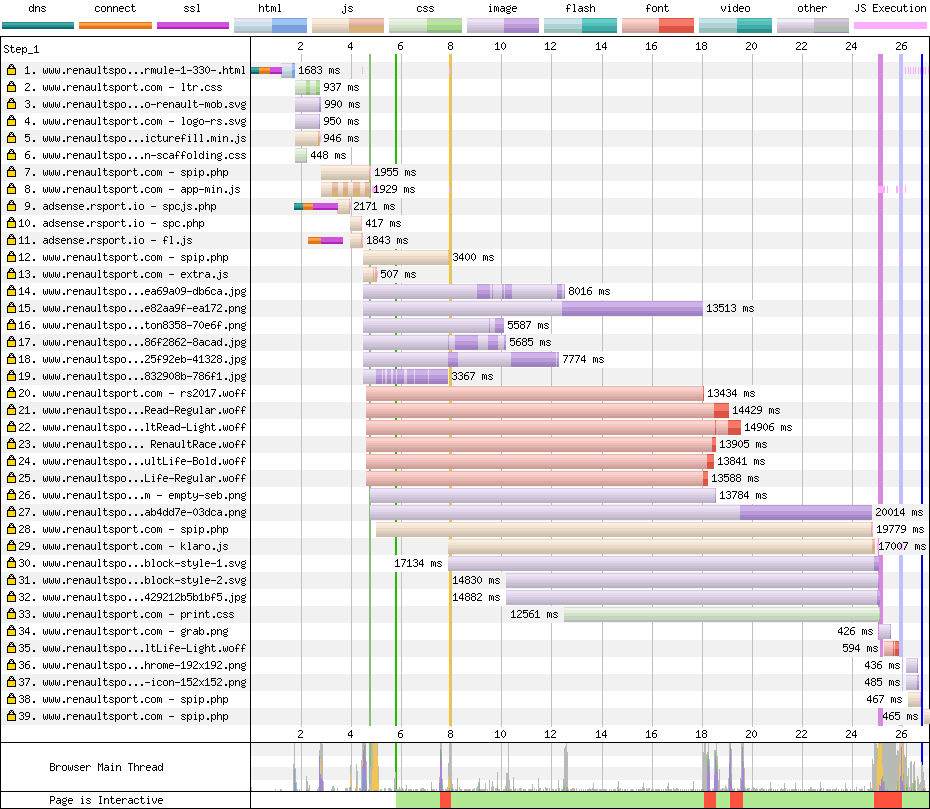
As with previous sites, render-blocking scripts account for the first 5.8s of nothing. These should use defer. However, this script doesn't get the page into an interactive state, it delivers a broken render.
Then, something interesting happens. The scripts that are needed to set up the page are at the bottom of the HTML, so the browser gives these important scripts a low priority.
You can see from the waterfall that the browser starts the download kinda late, but not that late. The darker area of the bars indicates the resource is actively downloading, but in this case the scripts are left waiting until other things such as images download. To fix this, these important scripts should be in the <head> and use the defer attribute. The page should be fixed so the before-JS render is usable.
The CSS is 85% unused, and the JS is ~55% unused, so it would benefit from splitting.
As with the other pages the fonts load late. It's especially bad here as images steal all the bandwidth (more on that in a second). Preloading fonts is a huge & quick win, and icon fonts should be replaced with SVG.
Second lap

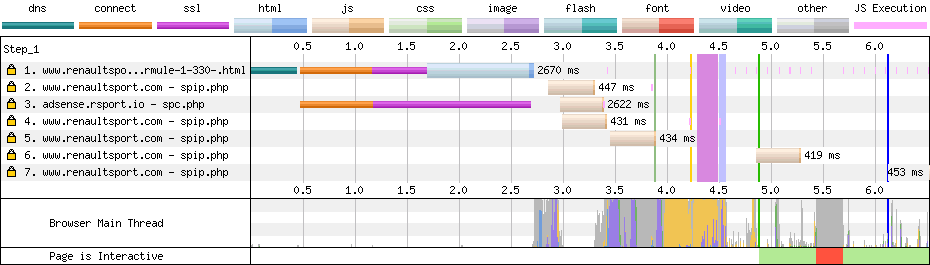
The caching is pretty good here, but a few uncached scripts push the complete render back to 5.9s. The first lap fixes would help here, along with some Cache-Control headers.
Images
Images play quite a big part in the performance here.
I took their first carousel image and put it through Squoosh. This took the size from 314k down to 59k as a JPEG, or 31k as WebP. I don't think the compression is too noticeable, especially as text will be rendered over the top. Judge for yourself.
Their driver pictures are PNGs, which is a bad choice for photo data. I can get one of them from 1mb down to 21k as a JPEG. See the results.
Result
- Mercedes 19.5s
- Ferrari 46.1s
- Red Bull 15.8s
- Renault 32.4s
The download priority of those important scripts hits hard here, and the images still all the bandwidth. These things can be easily fixed, but are slowing the site down by 15+ seconds.
- good HTTPS
- good HTTP/2
- good Gzip
- good Minification
- good Caching
- bad Image compression
- bad Render-blocking scripts
- bad Unstable render
- bad Main thread lock-up
- bad Unnecessary CSS
- bad Unnecessary JS
- bad Late-loading fonts
- bad Unnecessary icon fonts
Haas
Haas are the newest team in F1 (unless you count rebrands), so their website should be pretty new. They've kept their drivers from last year, despite one of them managing to crash at slow speeds for no reason, and blame another driver who wasn't there.
Their car looks pretty different this year with the arrival of a new sponsor, Rich Energy. Y'know, Rich Energy. The drink. You must have heard of it. Rich Energy. It's definitely not some sort of scam.
First lap

The user gets 4.5s of nothing, and then it's interactive! Pretty good!
It takes a long time for that first image to show, but hey, it doesn't block interactivity.
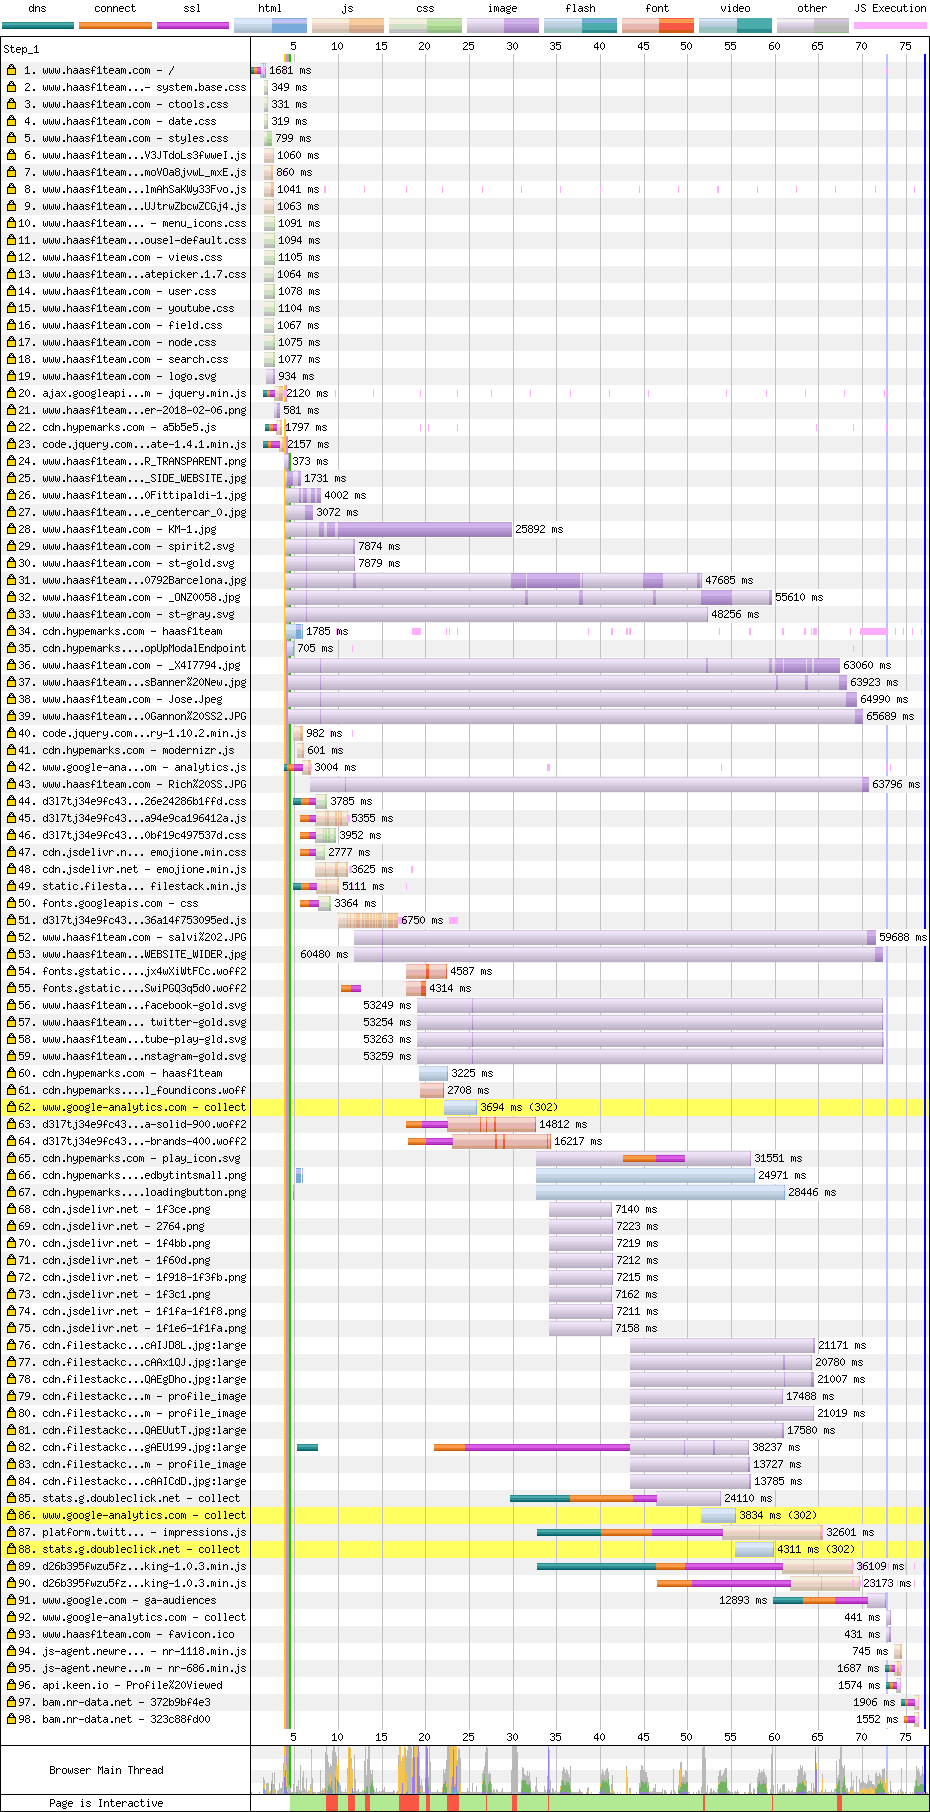
It terms of improvements, it's a similar story. There's a server render, but it's blocked by render-blocking scripts in the <head>.
These come from a couple of different servers, so they pay the price of additional HTTP connections. But, the amount of script blocking render is much smaller than other sites we've looked at so far.
Only a fraction of the JS and CSS is used, so splitting those up would really improve things. The main CSS isn't minified which hurts load time slightly.
Again, font preloading would help here.
Second lap

A good caching setup reduces the amount of network traffic. However a combination of image decoding, JavaScript, and layout hits hard, locking up the main thread until the 8 second mark.
Their second load is slower than their first. Because their overall load time for the first load is network-limited, things like image decoding and script execution happen gradually. In this case, it all lands at once.
Images
Things aren't great here. The first couple of carousel images are 3mb each, and look like they came straight off a digital camera. I guess they were uploaded via a CMS which doesn't recompress the images for the web.
Using Squoosh (have I mentioned Squoosh yet?), I can take those thumbnails from 3mb to around 56k as a JPEG, and 44k as WebP. See the results.
Result
- Mercedes 19.5s
- Ferrari 46.1s
- Red Bull 15.8s
- Renault 32.4s
- Haas 12.5s
Despite problems, they jump into 1st place! However, it feels like it could be a lot faster by solving some of the main-thread issues.
- good HTTPS
- good HTTP/2
- good Gzip
- good Minification (mostly)
- good Caching
- bad Image compression
- bad Render-blocking scripts
- bad Main thread lock-up
- bad Unnecessary CSS
- bad Unnecessary JS
- bad Late-loading fonts
McLaren
McLaren do sell the occasional car, but they're a racing team through and through. Although, in recent years, they've been a pretty slow racing team, and as a result they've lost their star driver. But will the website reflect the problems they're having on track?
First lap

In terms of user experience, the user gets nothing for the first 10.6 seconds, but the content jumps around until 24.3 seconds.
The first problem we see in the waterfall is the amount of additional connections needed. Their content is spread across many servers.
Their main CSS is 81k, but 90% unused for the initial render. Ideally the stuff needed for first render would be inlined, and the rest lazy-loaded.
Then there's a request for some fonts CSS (row 6). It's on yet another server, so we get another connection, and it serves a redirect to yet another server (row 10).
The CSS it eventually serves is 137k and uncompressed, and is mostly base64 encoded font data.
This is the biggest thing blocking first render. It's bad enough when text rendering is blocked on font loading, but in this case the whole page is blocked. Ideally, required fonts should be served as their own cachable resources, and preloaded.
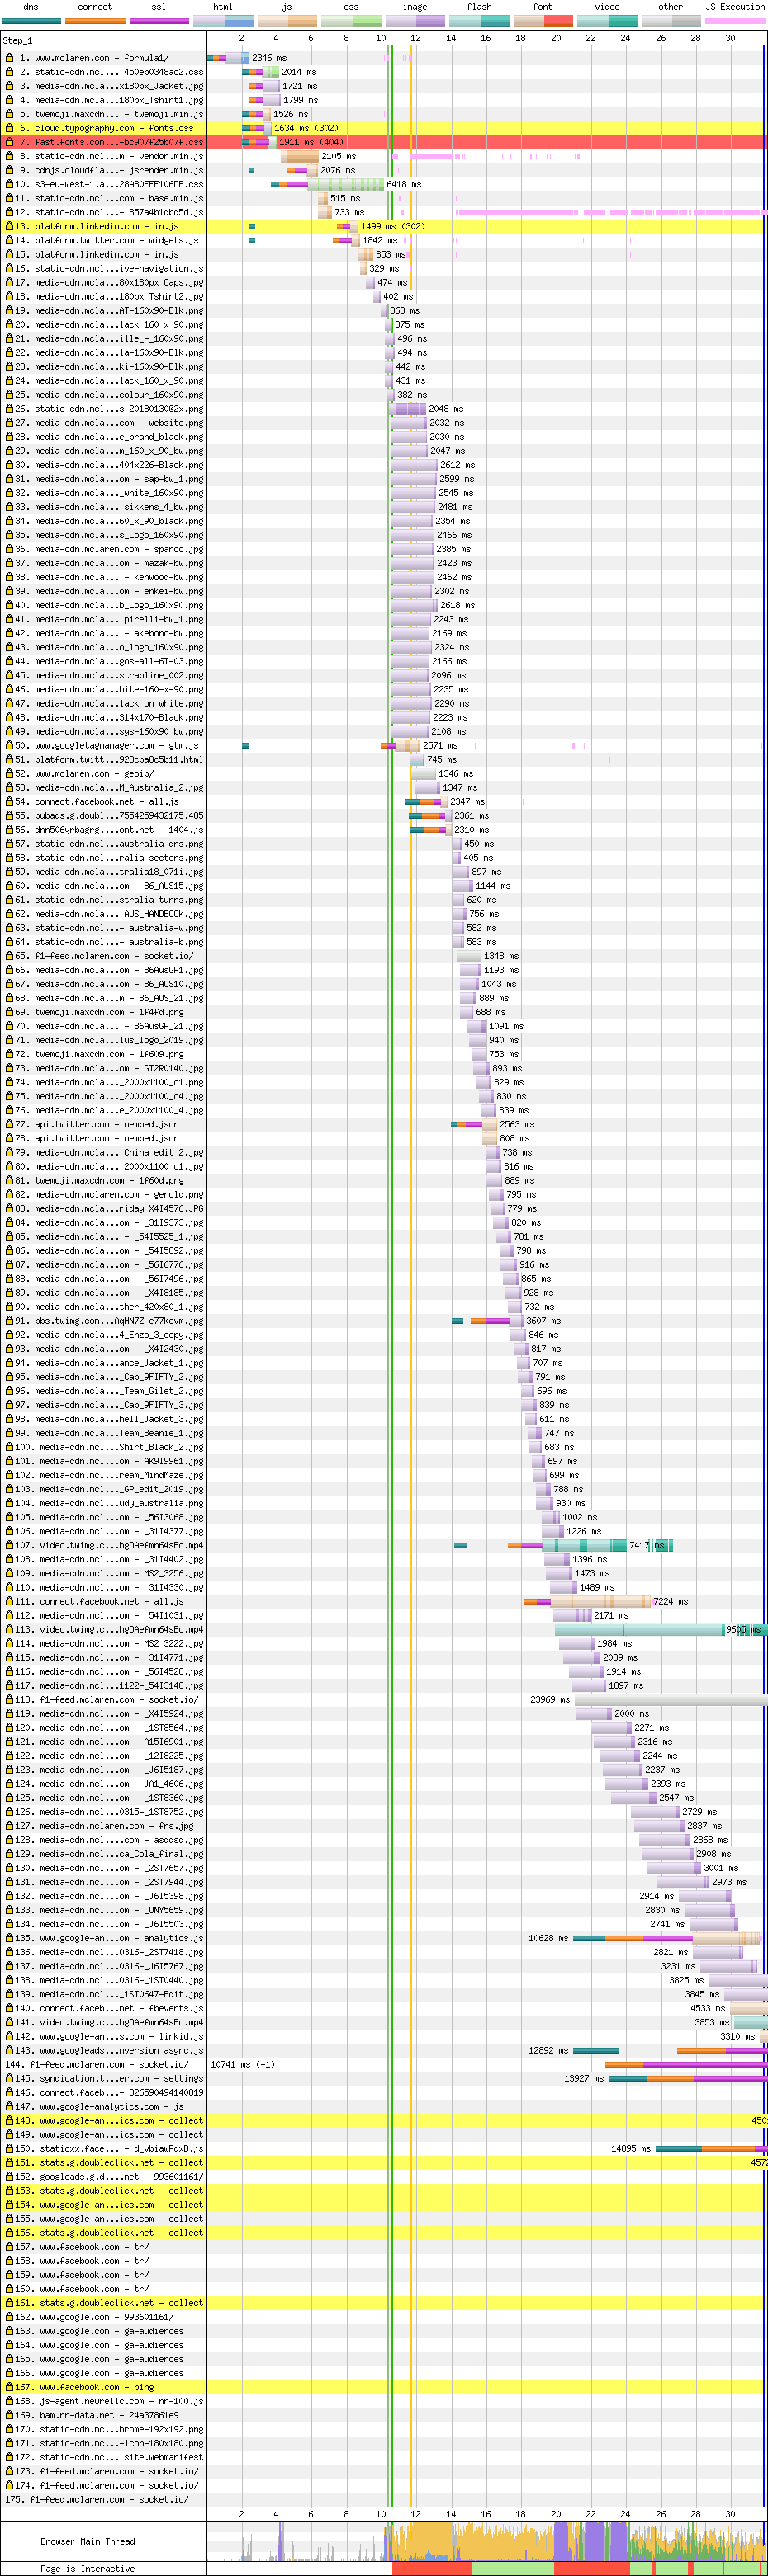
Then we get their JS bundle, which is 67% unused, so could benefit from some code splitting. It's also located at the bottom of the HTML, so it'd benefit from being in the <head> with defer. This would make it start downloading much sooner.
Then we get a request for 'jsrender', which seems to be the framework this site uses. This sits on yet another server, so they pay the price of yet another connection.
The content that appears at 24s is included as JSON within the HTML, and it isn't clear why it takes so long to render. Their main script uses a lot of main thread time, so maybe it's just taking ages to process all the template data, and isn't giving priority to the stuff that needs to appear at the top of the page.
This is the first site so far that serves its content in JavaScript rather than HTML.
Second lap

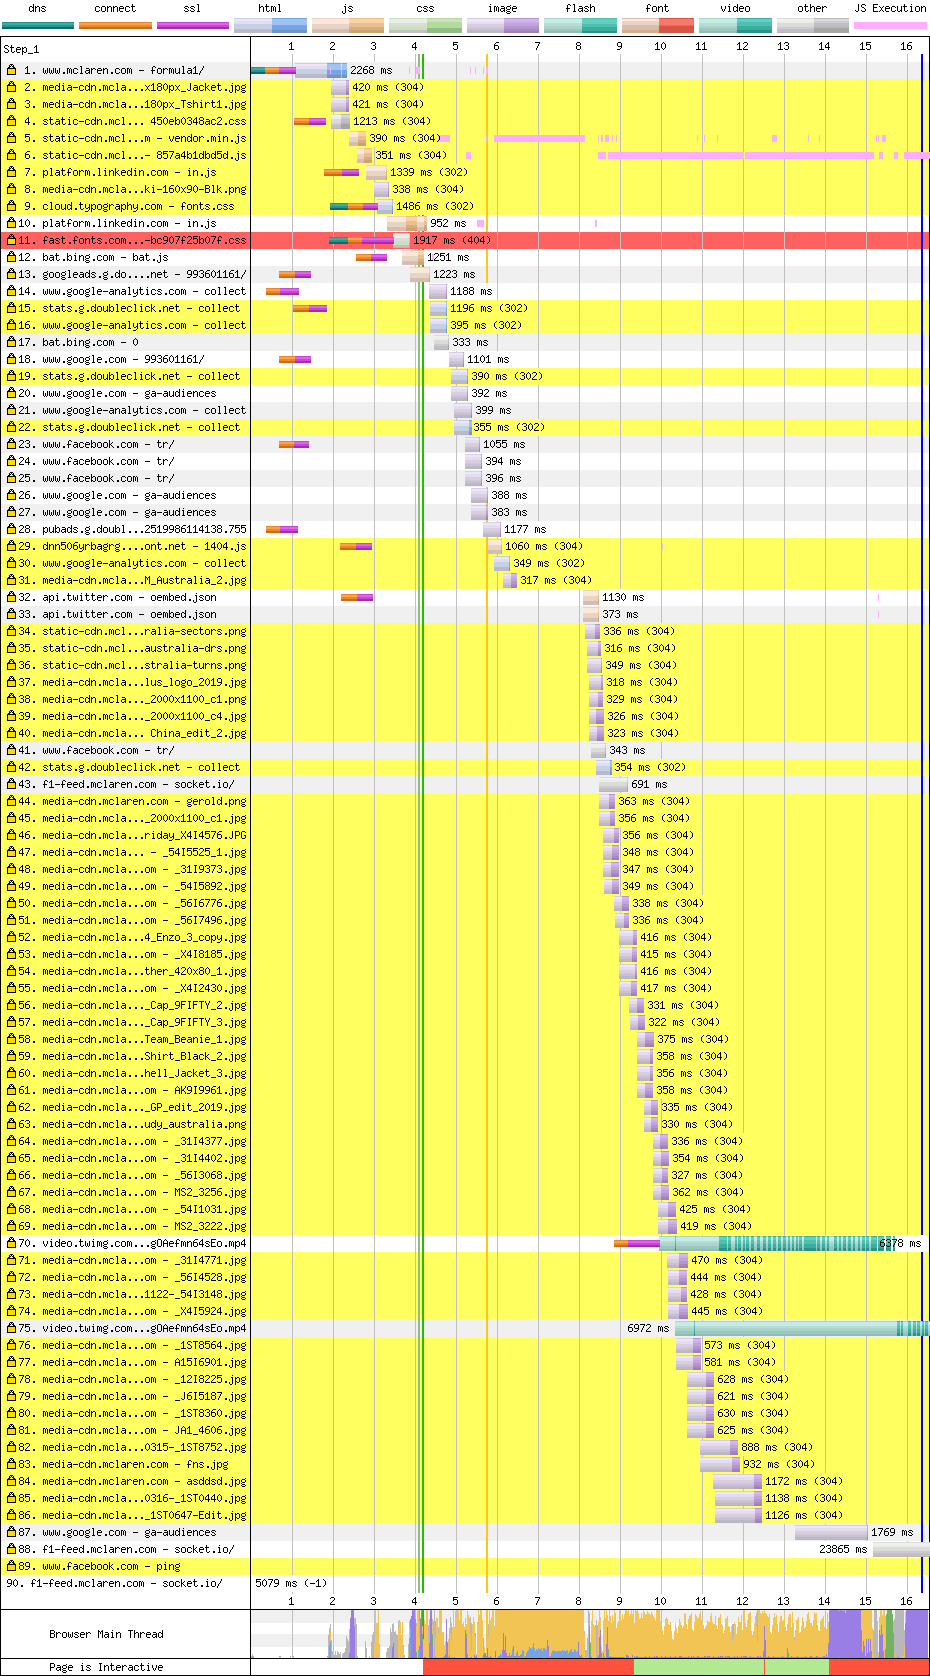
Caching headers are mostly absent, but browser heuristics make it look better than it is. The number of connections needed still hits hard, as does the JS processing time.
The content doesn't appear until 16.4s, and it's worth noting that the main thread is still really busy at this point.
Images
They have a 286k spritesheet which needs breaking up, and perhaps replaced with SVG. Usually I would try to reduce the palette on something like this, but it loses too much detail. Anyway, I can get it down from 286k to 238k as a PNG, and 145k as WebP without any loss at all. See the results.
They avoid downloading large images until the user scrolls, which is nice. Taking one of the images that arrives, I can get it down from 373k to 59k as a JPEG and 48k as WebP. See the results.
Result
- Mercedes 19.5s
- Ferrari 46.1s
- Red Bull 15.8s
- Renault 32.4s
- Haas 12.5s
- McLaren 40.7s
Not back-of-the-grid, but close. To be competitive, this site needs proper caching, fewer connections, and a decent before-JavaScript render.
- good HTTPS
- good HTTP/2
- good Gzip
- good Minification
- good Lazy-loading images
- bad Render-blocking scripts
- bad Unstable render
- bad No cache control
- bad Image compression
- bad Main thread lock-up
- bad Unnecessary CSS
- bad Unnecessary JS
- bad Late-loading fonts
- bad Too many HTTP connections
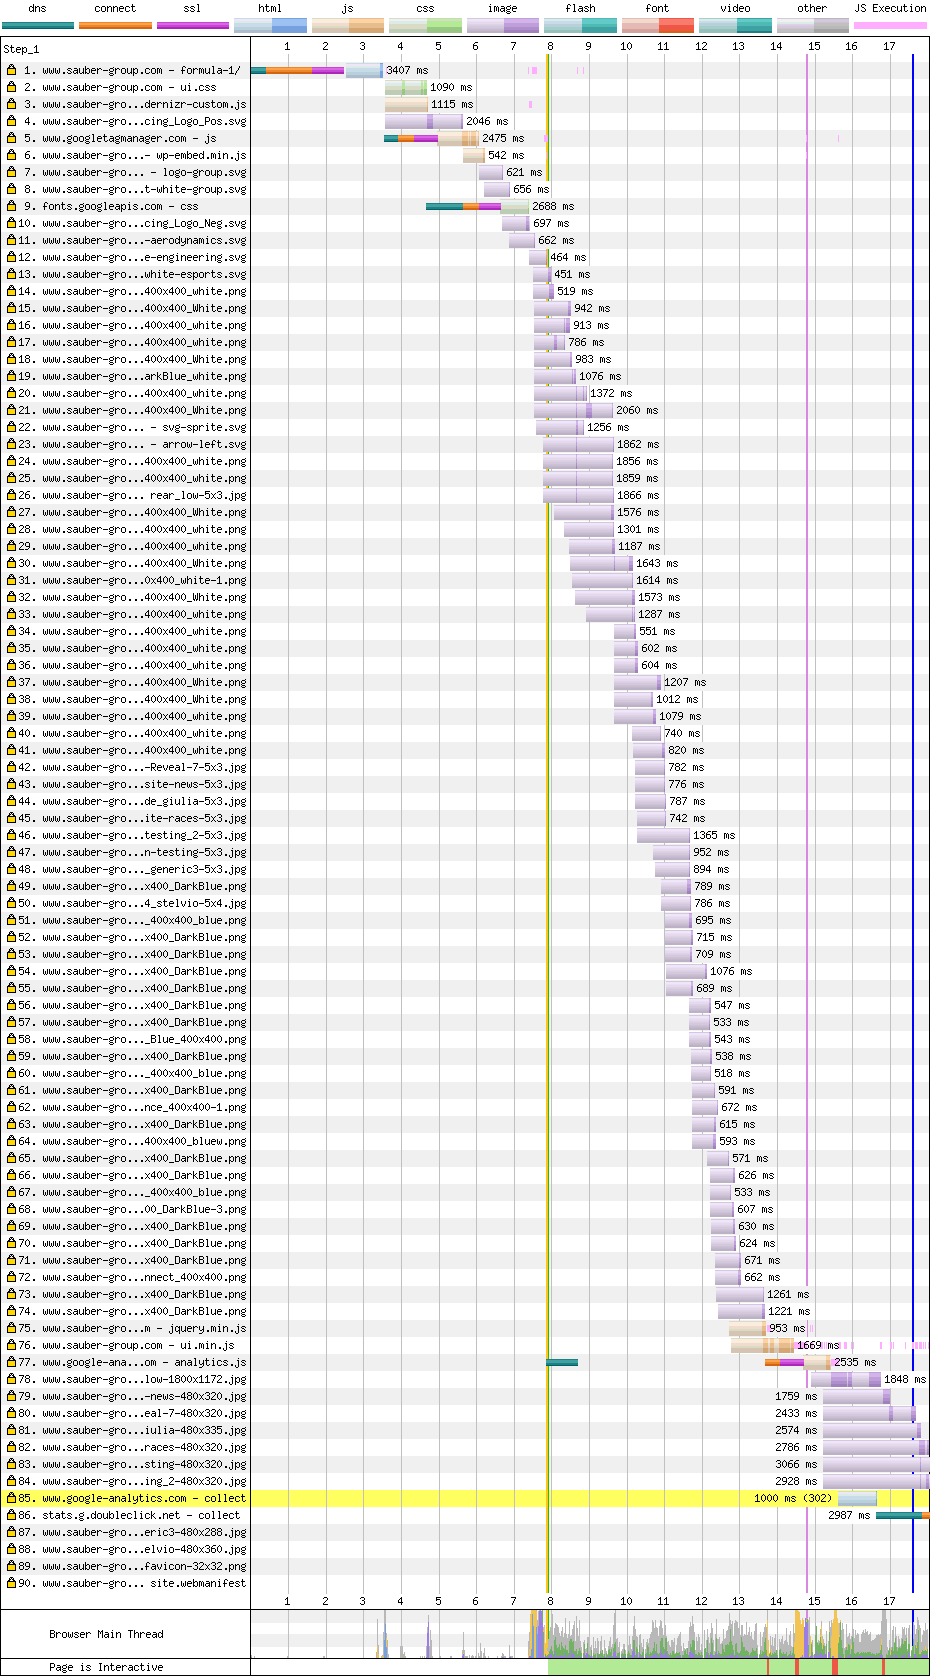
Racing Point
Lance Stroll wanted to be a racing driver, so daddy bought him an entire F1 team. That team is called Racing Point because I dunno maybe they were trying to pick the dullest name possible.
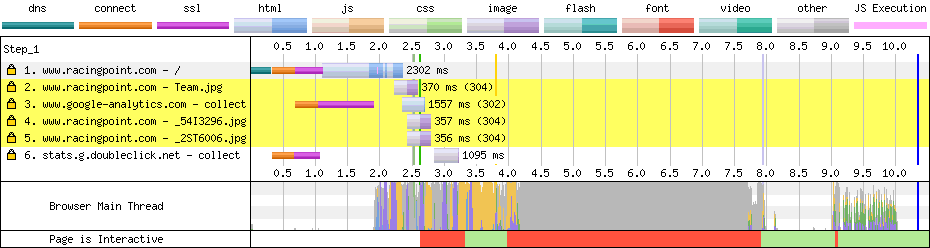
First lap

The user gets nothing for 45s, but the intended top-of-page content isn't ready until the 70s mark.
Also, the main thread is too busy for interaction until 76s.
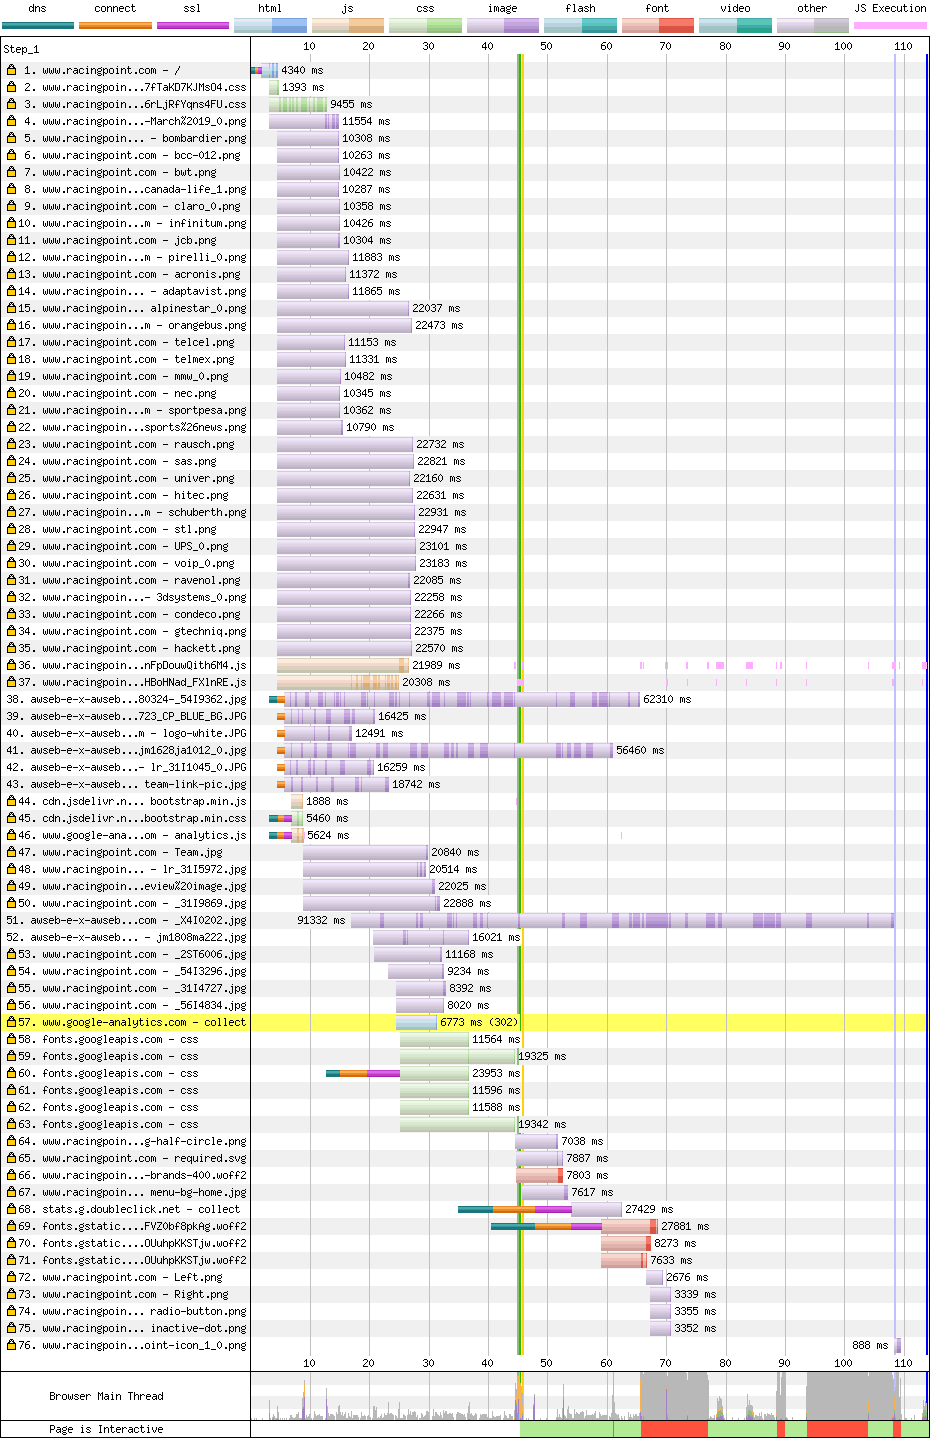
The page starts by downloading 300k of CSS that's served without minification, and without gzip. Minifying and gzipping would be a quick win here, but with over 90% of the CSS unused, it'd be better to split it up and serve just what this page needs.
Also, this CSS imports more CSS, from Google Fonts, so it pays the cost of another connection. But the main problem is the browser doesn't know it needs the fonts CSS until the main CSS downloads, and by that time there's a lot of stuff fighting for bandwidth.
<link rel="preload"> would be a huge and quick win here, to get that CSS downloading much earlier. It's the CSS that's currently blocking first render.
The site also suffers from late-loading scripts.
These scripts are at the bottom of the <body>, so they don't block rendering. However, if this JS is going to pop-in content at the top of the page, that space should be reserved so it doesn't move content around. Ideally a server-render of the carousel's first frame should be provided, which the JS can enhance. Also, these scripts should be in the <head> with defer so they start downloading earlier. Like the CSS, they lack minification and gzipping, which are quick wins. The JS is also 64% unused, so could be split up.
The carousel JS waits until the images (or at least the first image) has downloaded before displaying the carousel. Unfortunately the first image is 3mb. There's also a 6mb image on the page, but that isn't blocking that initial content render. These images need compressed (more on that in a second). The carousel should also avoid waiting on the images, and maybe provide a low resolution version while the full image downloads.
The main thread is then locked up for a bit. I haven't dug into why, but I suspect it's image decoding.
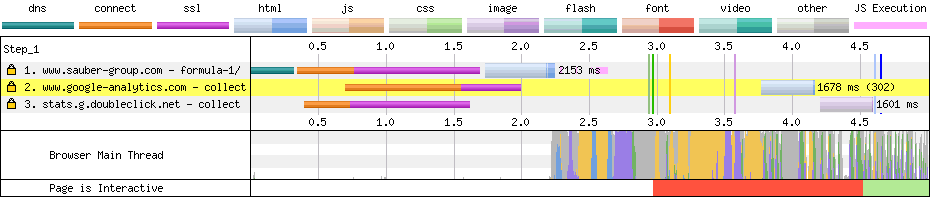
Second lap

The site has pretty good caching headers, so very little is redownloaded second time around. However, we don't get the main content until 8.2s due to main thread contention. This is a mixture of JavaScript, but mostly (I suspect) image decoding.
Images
For this one, image performance really matters in terms of first render. I got that 3mb image down to 57k as a JPEG, and 39k as WebP. The WebP is noticeably missing detail, but WebP's artefacts are less ugly than JPEG's so we can afford to go lower, especially since this image sits behind content. You be the judge.
Also, their logo is 117k. I'm sure the brand folks would like it to load a bit quicker. By resizing it and reducing colours to 100, I got it to 13k as a PNG, and 12k as WebP. See the results. An SVG might be even smaller.
Result
- Mercedes 19.5s
- Ferrari 46.1s
- Red Bull 15.8s
- Renault 32.4s
- Haas 12.5s
- McLaren 40.7s
- Racing Point 84.2s
You might have to scroll a bit to see this one.
The problem here is compression and timing. With image, CSS, JS compression, and some CSS preloading, this score would be < 20s. With a good server render of the carousel, it could be < 10s. Unfortunately it's back-of-the-grid for Racing Point.
- good HTTPS
- good HTTP/2
- good Caching
- good No render-blocking scripts
- bad No gzip
- bad No minification
- bad Image compression
- bad Unstable layout
- bad Main thread lock-up
- bad Unnecessary CSS
- bad Unnecessary JS
- bad Late-loading fonts
- bad Late-loading CSS
- bad Late-loading JS
Alfa Romeo
Alfa Romeo make cars, but they don't really make the one they race. The engine is a Ferrari, and the aero is the work of Sauber, which was the name of this team before 2019. But, a new brand often come with a new website. Let's see how it performs…
First lap

The user gets nothing for 7.9s, but they only get a spinner until 15.6s. You have to scroll to get content, but I'll count this as interactive.
The render is blocked until the Google Fonts CSS downloads, which points to a similar problem as Racing Point.
And yep, their main CSS (row 2) imports the Google Fonts CSS (row 9). This should be preloaded to allow the two to download in parallel. It's especially bad here, as the font they're downloading is Roboto, which already exists on Android, so no fonts are actually needed.
The main CSS is pretty small, but still 85% unused, so splitting and perhaps inlining would help a lot here.
After parsing the HTML, the browser discovers a load of images it needs to download, then a couple of scripts at the bottom of the page.
However, these scripts are essential to the rendering of the page, so they're loading far too late. A quick win would be to move them to the <head> (they already have defer). This would save around 8 seconds.
The JS is also 85% unused, so splitting would definitely help.
This page shouldn't need a spinner. Instead, it could have a before-JS render. The page is mostly static, so there aren't too many challenges here.
Second lap

The site makes excellent use of caching, but the JS-driven rendering slows things down. The main thread is jammed for a few seconds thanks to a combination of JavaScript and image decoding, getting to render in 4.5s.
The things which would make the first lap faster would also help here.
Images
The image right at the top of the page is 236k. Using Squoosh, I managed to get this down to 16k as a JPEG, and 9k as a PNG. See the results.
The page also loads a lot of logos. None of them are particularly big themselves, but they add up. I took one example from 18k down to 7k as a PNG. See the results. This kind of saving across all the logos would be significant.
Result
- Mercedes 19.5s
- Ferrari 46.1s
- Red Bull 15.8s
- Renault 32.4s
- Haas 12.5s
- McLaren 40.7s
- Racing Point 84.2s
- Alfa Romeo 20.1s
My gut tells me the quick-wins would knock 10 seconds off this time.
- good HTTPS
- good HTTP/2
- good Caching
- good Gzip
- good Minification
- bad Render-blocking scripts
- bad Image compression
- bad Main thread lock-up
- bad Unnecessary CSS
- bad Unnecessary JS
- bad Late-loading fonts
- bad Late-loading CSS
- bad Late-loading JS
Toro Rosso
It's the "stinky medicine" folks again. They fund two 'independent' teams in F1, with this one being a kinda "B team". But, can they beat their sister team on the web?
First lap

In terms of user experience, the user gets 4.7s of nothing. But, text doesn't start to appear until 5.4s. Then, more text appears gradually, and seems complete at 5.8s. Not bad!
Unfortunately the main thread is blocked until 8s. This looks like image decoding, but I'm not sure.
Very much like the other sites we've seen, they serve HTML but it's blocked by render-blocking scripts. They should use defer.
The CSS is 90% unused, and the JS is over 50% unused. Splitting would help here. There are also late-loading scripts that would benefit from being in the <head> with defer. There's also some unminified scripts thrown in there too. But, despite this, their JS & CSS isn't too big.
The biggest performance problem this site has is fonts. That's why the text comes in late.
The fonts are late-loading, so preloading them would have a huge benefit here.
The fonts are also a little big. Using woff2 would be a quick win here, but it might be worth considering getting rid of some of the fonts all together. But yeahhhhh that can be a tough argument to have.
Second lap

We get content at 5s, but the main thread is locked until 7s. Again, I think this is down to images.
The caching headers are mostly great, except for the fonts which only cache for 30 seconds. That's why we see so many revalidations in the waterfall above. Allowing the fonts to cache for longer would have saved a good few seconds here.
Images
You'll never guess what. I decided to use Squoosh here. Their top image isn't really optimised for mobile. I managed to get it down from 152k to 26k as a JPEG. See the results.
Result
- Mercedes 19.5s
- Ferrari 46.1s
- Red Bull 15.8s
- Renault 32.4s
- Haas 12.5s
- McLaren 40.7s
- Racing Point 84.2s
- Alfa Romeo 20.1s
- Toro Rosso 12.8s
So close! Only a couple of tenths off Haas. With font preloading and some image compression, they'd easily be in 1st place.
- good HTTPS
- good HTTP/2
- good Gzip
- good Minification (mostly)
- good Caching (mostly)
- bad Image compression
- bad Render-blocking scripts
- bad Main thread lock-up
- bad Unnecessary CSS
- bad Unnecessary JS
- bad Late-loading fonts
Williams
Williams are probably my favouite team. They're relatively small, independent, and have an incredible history. However, their last few seasons have been awful. Hopefully that won't reflect on their website…
First lap

In terms of user experience, the user sees nothing until 7.9s, but then they have visible content.
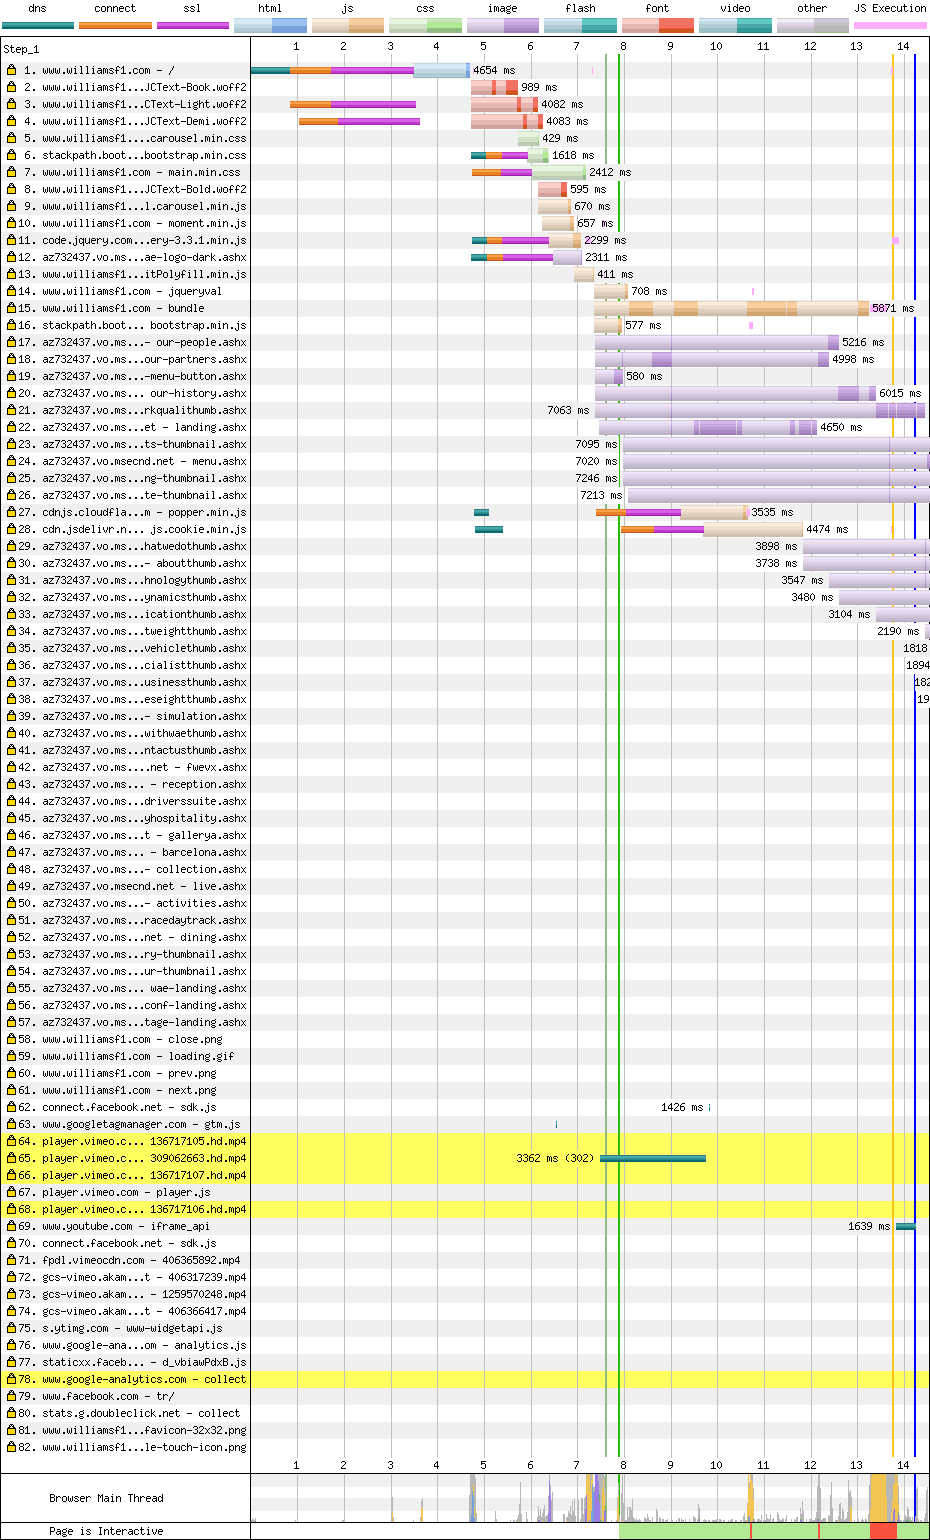
The first thing that stands out here is all the additional connections.
I thought this meant they were using a lot of different servers, but a closer look shows they're using old HTTP/1. This means the browser has to set up separate connections for concurrent downloads. A switch to HTTP/2 would be a big win.
But look, those fonts are arriving nice and early. A quick look at their source shows they're using <link rel="preload">, yay!
Then we get their CSS, which is fairly small but still 90% unused. Splitting and inlining these would show a big improvement.
Then we get a few render-blocking scripts in the head. These should be deferd to allow the server render to show before JS loads. The page is pretty much static so this shouldn't be too hard.
Their main JS loads at the end of the document, and it's a whopping 430k. This page barely needs any JS at all, so I'm pretty sure that can be significantly reduced, if not discarded. Thankfully it doesn't block render.
Second lap

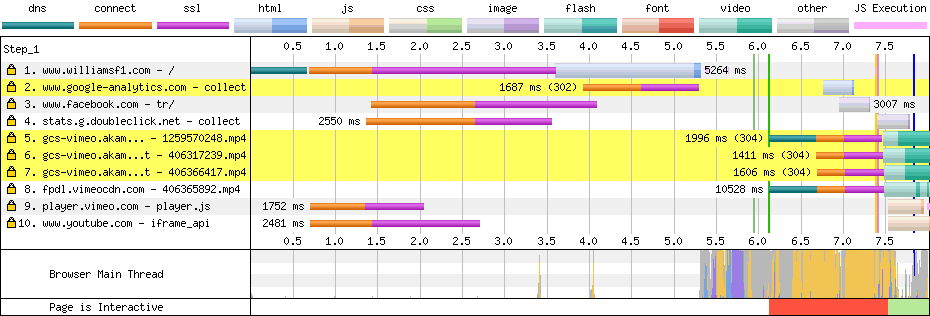
The caching headers are good, so very few requests are made on the second run. However, HTTP/1 slows down the initial request, then that massive script arrives from the cache and takes up 1.5s of main thread time. In total, it takes 6.2s to render.
The fixes from the first run will also fix these issues.
Images
I took a look at the main image. It's a wide image, but the sides aren't shown on mobile. Also, it has a dark overlay over the top, which reduces the fidelity of the image. I cropped the image a bit, and applied the overlaid colour to the image, so the compressor could optimise for it. Using Squoosh (drink!), I got the size from 267k to 48k as a JPEG, and 34k as WebP. Since text is rendered over the top, it might be reasonable to compress it more. See the results.
Result
- Mercedes 19.5s
- Ferrari 46.1s
- Red Bull 15.8s
- Renault 32.4s
- Haas 12.5s
- McLaren 40.7s
- Racing Point 84.2s
- Alfa Romeo 20.1s
- Toro Rosso 12.8s
- Williams 14.1s
Despite issues, this is one of the fastest times. With HTTP/2, it might have jumped into 1st place.
- good HTTPS
- good Gzip
- good Minification
- good Caching
- good Preloading fonts
- bad HTTP/1
- bad Render-blocking scripts
- bad Image compression
- bad Main thread lock-up
- bad Unnecessary CSS
- bad Unnecessary JS
Fantasy F1
I'm going to throw the official fantasy F1 site into the mix too. It's my blog I can do whatever I want.
First lap

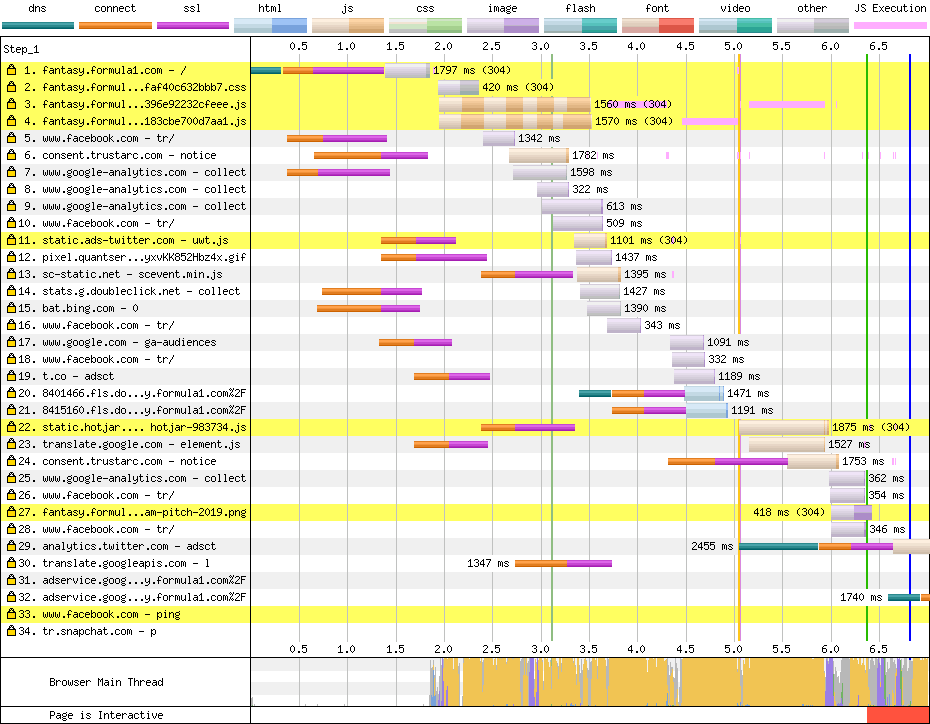
In terms of user experience, the user gets nothing until 12s. But the text for the main call-to-action doesn't display until 14.5s.

The main thread looks blocked until at least the 15s mark.
This is the first site we've seen with a near-empty <body>, and also the first to use one of the modern frameworks (Ember).
Initial render is blocked on CSS and render-blocking scripts.
Because the render is JavaScript driven, the browser doesn't know much about the resources it needs to download until Ember renders the page. That's why we see a load of requests begin around the 9.5s mark:
The page would benefit massively from a server render. But, given there isn't really any interactivity on this page, they could consider removing the JS all together, or preloading it for when it is needed. It certainly doesn't need 700k of JS. Netflix removed React from their landing page and saw a huge speed boost. The same could be done here.
The CSS is 95% unused, so it could be split up so this page can use the necessary parts.
The button text appears late because of late-loading fonts. Which is also excasserbated by the JavaScript-render.
As with other pages, this page would benefit hugely from font preloading. Also some of the fonts are TTFs. They're gzipped, but woff2 would be much smaller.
Second lap

The JS URLs look versioned, but their Cache-Control header requires the browser to check for an update every time. You can see that in the 304 responses in the waterfall.
Once the scripts have landed, they lock up the main thread until at least the 7s mark. Again, removing JavaScript and making this a mostly static page would improve things massively.
Images
In terms of images, I took a look at the main background image at the top of the page. The team have clearly tried to make this small, because the JPEG compression is pretty visible. However, it has the same problem as the Williams image – most of it isn't visible on mobile, and it has an overlay.
I baked the overlay into the image, cropped it a bit, and took it down from 170k down to 54k as a JPEG, and 43k as WebP. It might be possible to go lower, but I was already dealing with an image with a lot of compression artefacts. See the result.
There's also a 219k PNG. I think it's a PNG because it has transparency, but it's only ever displayed over a white background. I gave it a solid background, and took it down to 38k as a JPEG, and 20k as WebP. See the result.
Another image caught my eye. There's an image of the Spanish flag as an SVG (29k), which can be optimised via SVGOMG to 15k. However, the Spanish flag is pretty intricate, and displayed really tiny on the site (30x22). I got it down to 1.2k as a PNG, and 800b as WebP. See the result.
Although SVG is usually the best choice for logos, sometimes a PNG/WebP is better.
Result
- good HTTPS
- good HTTP/2
- good Gzip
- good Minification
- bad Render-blocking scripts
- bad Main thread lock-up
- bad Image compression
- bad Unnecessary CSS
- bad Unnecessary JS
- bad Poor caching
- bad Late-loading fonts
- bad Late-loading images
And that's the last site. How do the all compare?
Final results
Ok here we go!
- Mercedes 19.5s
- Ferrari 46.1s
- Red Bull 15.8s
- Renault 32.4s
- Haas 12.5s
- McLaren 40.7s
- Racing Point 84.2s
- Alfa Romeo 20.1s
- Toro Rosso 12.8s
- Williams 14.1s
- Fantasy F1 22.0s
Congratulations to the Haas team who cross the finishing line first, and have the fastest website in Formula One. Toro Rosso are really close, and Williams complete the podium.
Final thoughts
This has been kinda eye-opening for me. In my job, I feel I spend a lot of time trying to convince users of frameworks to get a meaningful static/server render as part of their build process early on. It has a huge impact on performance, it gives you the option of dropping the client-side part of the framework for particular pages, and it's incredibly hard to add later. However, none of the teams used any of the big modern frameworks. They're mostly Wordpress & Drupal, with a lot of jQuery. It makes me feel like I've been in a bubble in terms of the technologies that make up the bulk of the web.
It's great to see HTTPS, HTTP/2, gzip, minification, and decent caching widely used. These are things folks in the performance community have been pushing for a long time, and it seems like it's paid off.
However, one of the bits of performance advice we've been pushing the longest is "don't use render-blocking scripts", yet every site has them. Most of the sites have some sort of server/static render, but the browser can't display it due to these blocking scripts.
Pretty much every site would massively benefit from font preloading. Although I'm not suprised it's missing from most sites, as preloading hasn't been in browsers as long as other performance primitives. I guess code splitting is newish too, which is why there isn't a lot of it.
It feels like the quick-wins would cut the times down by 25%, if not more. An unblocked render would bring many down to the 5 second mark.
Some of the issues feel like they may have happened after the site was launched. Eg, a too-big image was uploaded, or a massive horse was added to the header. RUM metrics and build reporting would have helped here – developers would have seen performance crashing as the result of a particular change.
They aren't totally comparable, but this page (which is kinda huge and has a lot of images) would score 4.6s on the same test (results). Squoosh would score 4.2s (results), but we spent a lot of time on performance there. Most of this is down to an unblocked initial render and code splitting.
Anyway, does this mean Haas are going to win the 2019 Formula One season? Probably. I mean, it makes sense right?
