Who has the fastest F1 website in 2021? Part 4
This is part 4 in a multi-part series looking at the loading performance of F1 websites. Not interested in F1? It shouldn't matter. This is just a performance review of 10 recently-built/updated sites that have broadly the same goal, but are built by different teams, and have different performance issues.
- Part 1: Methodology & Alpha Tauri
- Part 2: Alfa Romeo
- Part 3: Red Bull
- ➡️ Part 4: Williams
- Part 5: Aston Martin
- Part 6: Ferrari
- Part 7: Haas
- Part 8: McLaren
- Bonus: Google I/O
- …more coming soon…
Williams

- Link
- First run
-
6.7s (raw results)
- Second run
-
4.4s (raw results)
- Total
-
11.1s
- 2019 total
Not bad! And it's nice to see the cookie modal appearing along with the content. Well, not nice, but y'know, better than it slamming you in the face 30 seconds later.
Possible improvements
- 2 seconds delay to content-render caused by CSS serving issues. Covered in detail below.
- 4 second delay to main image caused by HTTP/1.1 and priorities, and additional connections. Covered in detail below.
- Layout instability caused by
<img>s. Covered in detail below.
Remember these delays overlap in some cases.
Key issue: Delayed CSS
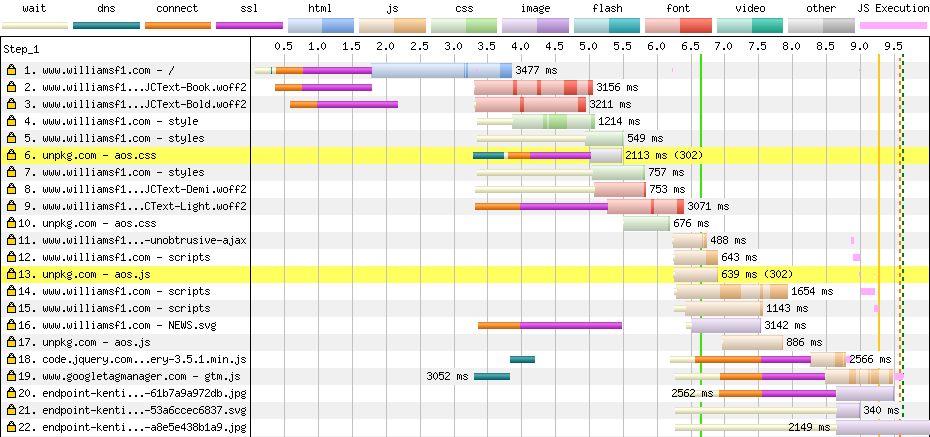
Here's the start of the waterfall:
There are a couple of bad smells here. On row 6 we see a new connection being made for some render-blocking CSS on another server. This is the problem I covered in part 1, and the solution is to move the CSS onto the same server as the page, which would save around 1.5 seconds.
But, in addition to that, the server issues a redirect, so the real resource isn't received until row 10. This wastes at least another 0.5 seconds. Again, the solution is to move the CSS to the same server, and perhaps bundle it with the current CSS.
Key issue: HTTP/1.1
Again, looking at the start of the waterfall:
See how it immediately starts three connections to the same server (the thinner part of the bar at the start of rows 1-3), and again in row 9? This is the old musty stench of HTTP/1.1, and Chrome DevTools confirms it:
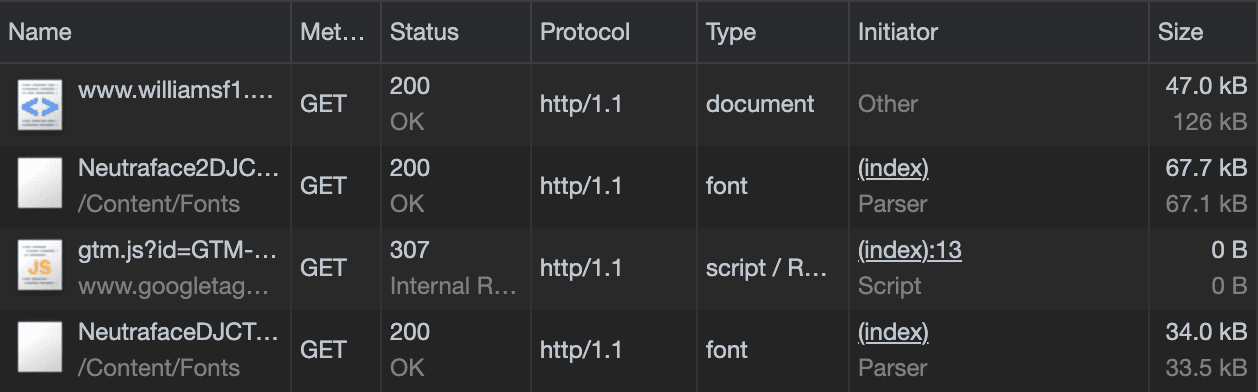
HTTP/1.1 can only handle a single request/response over a connection, unlike HTTP/2 which can handle many in parallel. To try to work around the shortcomings of HTTP/1.1 the browser immediately spins up multiple connections to the server, and even more later on.
It's unclear to me how much of an impact this causes in terms of first-render, but it's likely to get in the way of other optimisations such as moving more content to the same server, since browsers will only download 6-8 things at once over HTTP/1.1.
Key issue: Layout instability due to <img>
It isn't visible in the video earlier due to the cookie modal, but once you've cleared that, you start to see some layout instability:
Here's (roughly) the HTML:
<img src="…" alt="…" />And here's the CSS:
img {
  display: block;
  width: 100%;
}
When this happens, the image takes up zero space until the browser downloads enough of the image to know its width and height, and then it reserves space for the image.
Ideally we want the space reserved on the page before the image starts downloading. Thankfully, that isn't too difficult:
HTML:
<img width="600" height="315" src="…" alt="…" />…where the width and height give the correct aspect ratio of the image. And the CSS:
img {
  display: block;
  width: 100%;
  height: auto;
}
Now the browser will assume a 600/315 aspect ratio for the image even before it downloads, meaning there's no layout shift:
This technique is new in the grand scheme of things, but well supported.
Issue: Delay to main image
Something is delaying the images:
The main images start appearing in row 20. Yes, they're on another server so they're delayed by having to set up a new connection, but something is causing that to happen really late. Those images are <img>s in the source, so I'd expect them to be picked up before the CSS completed.
I imagine this problem would become irrelevant once HTTP/2 was adopted, and key assets were moved onto the same server. However, I wanted to figure out why those assets were downloading so late, so I used an advanced debugging technique called "emailing folks who work on Chrome's networking internals", and here's what I found was told:
- Images start out as 'lowest priority'.
- Images in the viewport are bumped to 'medium priority'.
- Chrome will only download 'lowest priority' things one-at-a-time, and will also queue behind 'medium priority' items.
And if we apply that knowledge to the waterfall:
- There's no way to know if an image is in the viewport or not until layout-blocking resources have loaded.
- The CSS issues mentioned earlier delay layout for a long time, keeping those important images 'lowest priority'.
- Font preloads (rows 2, 3, 8, 9) are 'medium priority', so they queue ahead of the images.
- HTTP/1.1 delays things in row 9, as we're waiting on another connection in the pool. This wouldn't be an issue with HTTP/2.
- The images are on another server, so by the time the browser finally gets round to them, it's delayed even further.
So it's a real smorgasbord of issues that adds up to a big ol' delay.
You might be thinking "a different set of rules would result in a faster page load time", and that might be true for this page, but request priorities are a delicate balancing act. Some 'totally obvious common-sense' changes we've trialled have resulted in worse performance in the wild.
Issue: Large main image
As we've seen with most sites so far, main images end up being a bit too big. They serve the same banner for desktop and mobile, meaning mobile is getting way more data than it needs. Responsive images mean the browser can pick the size and format that works best for the device. Here it is optimised for mobile using Squoosh:
But even at full-size that image could be 30-40kB. That said, many of the images on the site are well compressed… dare I say, too compressed? I'm never happy am I?
How fast could it be?
Here's how fast it looks with the first-render unblocked and the images optimised. I threw in some blurry image previews too.
- Original
- Optimised
Scoreboard

| Score | vs 2019 | |||
|---|---|---|---|---|
Red Bull | 8.6 | -7.2 | Leader | |
Williams | 11.1 | -3.0 | +2.5 | |
Alpha Tauri | 22.1 | +9.3 | +13.5 | |
Alfa Romeo | 23.4 | +3.3 | +14.8 |
Williams slots in just a couple of seconds behind Red Bull, and it's great to see another site improving on their 2019 performance!
It's Aston Martin up next. I was going to roll it into this part, since it didn't bring up anything new, but then I spotted a real gotcha that's difficult to debug (yes this is my attempt at a teaser). See you tomorrow!
- Part 1: Methodology & Alpha Tauri
- Part 2: Alfa Romeo
- Part 3: Red Bull
- ➡️ Part 4: Williams
- Part 5: Aston Martin
- Part 6: Ferrari
- Part 7: Haas
- Part 8: McLaren
- Bonus: Google I/O
- …more coming soon…